Duke Energy 2011 Annual Report Download - page 214
Download and view the complete annual report
Please find page 214 of the 2011 Duke Energy annual report below. You can navigate through the pages in the report by either clicking on the pages listed below, or by using the keyword search tool below to find specific information within the annual report.-
 1
1 -
2
-
3
-
4
-
5
-
6
-
7
-
8
-
9
-
10
-
11
-
12
-
13
-
14
-
15
-
16
-
17
-
18
-
19
-
20
-
21
-
22
-
23
-
24
-
25
-
26
-
27
-
28
-
29
-
30
-
31
-
32
-
33
-
34
-
35
-
36
-
37
-
38
-
39
-
40
-
41
-
42
-
43
-
44
-
45
-
46
-
47
-
48
-
49
-
50
-
51
-
52
-
53
-
54
-
55
-
56
-
57
-
58
-
59
-
60
-
61
-
62
-
63
-
64
-
65
-
66
-
67
-
68
-
69
-
70
-
71
-
72
-
73
-
74
-
75
-
76
-
77
-
78
-
79
-
80
-
81
-
82
-
83
-
84
-
85
-
86
-
87
-
88
-
89
-
90
-
91
-
92
-
93
-
94
-
95
-
96
-
97
-
98
-
99
-
100
-
101
-
102
-
103
-
104
-
105
-
106
-
107
-
108
-
109
-
110
-
111
-
112
-
113
-
114
-
115
-
116
-
117
-
118
-
119
-
120
-
121
-
122
-
123
-
124
-
125
-
126
-
127
-
128
-
129
-
130
-
131
-
132
-
133
-
134
-
135
-
136
-
137
-
138
-
139
-
140
-
141
-
142
-
143
-
144
-
145
-
146
-
147
-
148
-
149
-
150
-
151
-
152
-
153
-
154
-
155
-
156
-
157
-
158
-
159
-
160
-
161
-
162
-
163
-
164
-
165
-
166
-
167
-
168
-
169
-
170
-
171
-
172
-
173
-
174
-
175
-
176
-
177
-
178
-
179
-
180
-
181
-
182
-
183
-
184
-
185
-
186
-
187
-
188
-
189
-
190
-
191
-
192
-
193
-
194
-
195
-
196
-
197
-
198
-
199
-
200
-
201
-
202
-
203
-
 204
204 -
 205
205 -
 206
206 -
 207
207 -
 208
208 -
 209
209 -
 210
210 -
 211
211 -
 212
212 -
 213
213 -
 214
214 -
 215
215 -
 216
216 -
 217
217 -
 218
218 -
 219
219 -
 220
220 -
 221
221 -
 222
222 -
 223
223 -
 224
224 -
225
-
226
-
227
-
228
-
229
-
230
-
231
-
232
-
233
-
234
-
235
-
236
-
237
-
238
-
239
-
240
-
241
-
242
-
243
-
244
-
245
-
246
-
247
-
248
-
249
-
250
-
251
-
252
-
253
-
254
-
255
-
256
-
257
-
258
-
259
-
260
-
261
-
262
-
263
-
264
-
265
-
266
-
267
-
268
-
269
-
270
-
271
-
272
-
273
-
274
-
275
 |
 |

PART II
DUKE ENERGY CORPORATION •DUKE ENERGY CAROLINAS, LLC •DUKE ENERGY OHIO, INC. •DUKE ENERGY INDIANA, INC.
Combined Notes to Consolidated Financial Statements – (Continued)
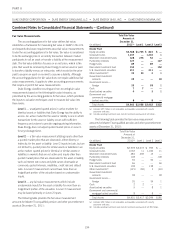
Fair Value Measurements.
The accounting guidance for fair value defines fair value,
establishes a framework for measuring fair value in GAAP in the U.S.
and expands disclosure requirements about fair value measurements.
Under the accounting guidance for fair value, fair value is considered
to be the exchange price in an orderly transaction between market
participants to sell an asset or transfer a liability at the measurement
date. The fair value definition focuses on an exit price, which is the
price that would be received by Duke Energy to sell an asset or paid
to transfer a liability versus an entry price, which would be the price
paid to acquire an asset or received to assume a liability. Although
the accounting guidance for fair value does not require additional fair
value measurements, it applies to other accounting pronouncements
that require or permit fair value measurements.
Duke Energy classifies recurring and non-recurring fair value
measurements based on the following fair value hierarchy, as
prescribed by the accounting guidance for fair value, which prioritizes
the inputs to valuation techniques used to measure fair value into
three levels:
Level 1 — unadjusted quoted prices in active markets for
identical assets or liabilities that Duke Energy has the ability to
access. An active market for the asset or liability is one in which
transactions for the asset or liability occurs with sufficient
frequency and volume to provide ongoing pricing information.
Duke Energy does not adjust quoted market prices on Level 1
for any blockage factor.
Level 2 — a fair value measurement utilizing inputs other than
a quoted market price that are observable, either directly or
indirectly, for the asset or liability. Level 2 inputs include, but are
not limited to, quoted prices for similar assets or liabilities in an
active market, quoted prices for identical or similar assets or
liabilities in markets that are not active and inputs other than
quoted market prices that are observable for the asset or liability,
such as interest rate curves and yield curves observable at
commonly quoted intervals, volatilities, credit risk and default
rates. A Level 2 measurement cannot have more than an
insignificant portion of the valuation based on unobservable
inputs.
Level 3 — any fair value measurements which include
unobservable inputs for the asset or liability for more than an
insignificant portion of the valuation. A Level 3 measurement
may be based primarily on Level 2 inputs.
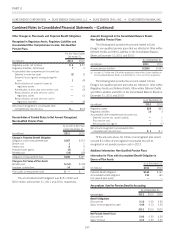
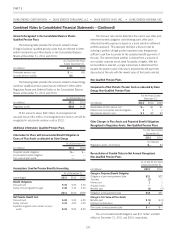
Thefollowingtableprovidesthefairvaluemeasurement
amounts for Master Trust qualified pension and other post-retirement
assets at December 31, 2011:
(in millions)
Total Fair Value
Amounts at
December 31,
2011(a) Level 1 Level 2 Level 3
Master Trust
Equity securities $2,568 $1,745 $ 823 $ —
Corporate bonds 1,237 — 1,236 1
Short-term investment funds 328 276 52 —
Partnership interests 127 — — 127
Hedge funds 89 — 89 —
Real estate investment trust 152 — — 152
U.S. Government securities 211 — 211 —
Other investments(b) 33 30 2 1
Guaranteed investment
contracts 39 — — 39
Government bonds —
Foreign 39 — 38 1
Cash 77——
Asset backed securities 4— 3 1
Government and
commercial mortgage
backed securities 8— 8—
Total Assets $4,842 $2,058 $2,462 $322
(a) Excludes $27 million in net receivables and payables associated with security
purchases and sales.
(b) Includes pending investment sales (netofinvestmentpurchases)of$3million.
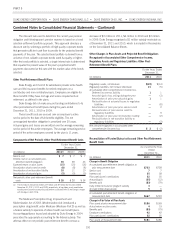
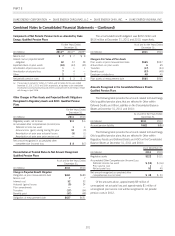
Thefollowingtableprovidesthefairvaluemeasurement
amounts for Master Trust qualified pension and other post-retirement
assets at December 31, 2010:
(in millions)
TotalFairValue
Amounts at
December 31,
2010(a) Level 1 Level 2 Level 3
Master Trust
Equity securities $2,978 $2,019 $ 959 $ —
Corporate bonds 1,062 11 1,040 11
Short-term investment funds 484 469 15 —
Partnership interests 108 — — 108
Hedge funds 94 — 94 —
Real estate investment trust 66 — — 66
U.S. Government securities 138 — 138 —
Other investments(b) (121) (84) 3 (40)
Guaranteed investment
contracts 38 — — 38
Government bonds —
Foreign 35 — 34 1
Cash 2 2 — —
Asset backed securities 9 — 8 1
Government and commercial
mortgage backed securities 8 — 8 —
Total Assets $4,901 $2,417 $2,299 $185
(a) Excludes $23 million in net receivables and payables associated with security
purchases and sales.
(b) Includes pending investment sales (net of investment purchases) of $(139) million.
194