Duke Energy 2011 Annual Report Download - page 176
Download and view the complete annual report
Please find page 176 of the 2011 Duke Energy annual report below. You can navigate through the pages in the report by either clicking on the pages listed below, or by using the keyword search tool below to find specific information within the annual report.-
 1
1 -
2
-
3
-
4
-
5
-
6
-
7
-
8
-
9
-
10
-
11
-
12
-
13
-
14
-
15
-
16
-
17
-
18
-
19
-
20
-
21
-
22
-
23
-
24
-
25
-
26
-
27
-
28
-
29
-
30
-
31
-
32
-
33
-
34
-
35
-
36
-
37
-
38
-
39
-
40
-
41
-
42
-
43
-
44
-
45
-
46
-
47
-
48
-
49
-
50
-
51
-
52
-
53
-
54
-
55
-
56
-
57
-
58
-
59
-
60
-
61
-
62
-
63
-
64
-
65
-
66
-
67
-
68
-
69
-
70
-
71
-
72
-
73
-
74
-
75
-
76
-
77
-
78
-
79
-
80
-
81
-
82
-
83
-
84
-
85
-
86
-
87
-
88
-
89
-
90
-
91
-
92
-
93
-
94
-
95
-
96
-
97
-
98
-
99
-
100
-
101
-
102
-
103
-
104
-
105
-
106
-
107
-
108
-
109
-
110
-
111
-
112
-
113
-
114
-
115
-
116
-
117
-
118
-
119
-
120
-
121
-
122
-
123
-
124
-
125
-
126
-
127
-
128
-
129
-
130
-
131
-
132
-
133
-
134
-
135
-
136
-
137
-
138
-
139
-
140
-
141
-
142
-
143
-
144
-
145
-
146
-
147
-
148
-
149
-
150
-
151
-
152
-
153
-
154
-
155
-
156
-
157
-
158
-
159
-
160
-
161
-
162
-
163
-
164
-
165
-
 166
166 -
 167
167 -
 168
168 -
 169
169 -
 170
170 -
 171
171 -
 172
172 -
 173
173 -
 174
174 -
 175
175 -
 176
176 -
 177
177 -
 178
178 -
 179
179 -
 180
180 -
 181
181 -
 182
182 -
 183
183 -
 184
184 -
 185
185 -
 186
186 -
187
-
188
-
189
-
190
-
191
-
192
-
193
-
194
-
195
-
196
-
197
-
198
-
199
-
200
-
201
-
202
-
203
-
204
-
205
-
206
-
207
-
208
-
209
-
210
-
211
-
212
-
213
-
214
-
215
-
216
-
217
-
218
-
219
-
220
-
221
-
222
-
223
-
224
-
225
-
226
-
227
-
228
-
229
-
230
-
231
-
232
-
233
-
234
-
235
-
236
-
237
-
238
-
239
-
240
-
241
-
242
-
243
-
244
-
245
-
246
-
247
-
248
-
249
-
250
-
251
-
252
-
253
-
254
-
255
-
256
-
257
-
258
-
259
-
260
-
261
-
262
-
263
-
264
-
265
-
266
-
267
-
268
-
269
-
270
-
271
-
272
-
273
-
274
-
275
 |
 |

PART II
DUKE ENERGY CORPORATION •DUKE ENERGY CAROLINAS, LLC •DUKE ENERGY OHIO, INC. •DUKE ENERGY INDIANA, INC.
Combined Notes to Consolidated Financial Statements – (Continued)
Impairments.
There were no significant pre-tax impairment charges to the
carrying value of investments in unconsolidated affiliates during the
year ended December 31, 2011. During the years ended
December 31, 2010 and 2009, Duke Energy recorded pre-tax
impairment charges to the carrying value of investments in
unconsolidated affiliates of $11 million and $21 million, respectively.
Approximately $18 million of the impairment charge recorded during
the year ended December 31, 2009 relates to International Energy’s
investment in Attiki, (discussed above). These impairment charges,
which were recorded in Gains (Losses) on Sales of Unconsolidated
Affiliates on the Consolidated Statements of Operations, were
recorded as a result of Duke Energy concluding that it would not be
able to recover its carrying value in these investments, thus the
carrying value of these investments were written down to their
estimated fair value.
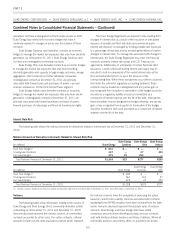
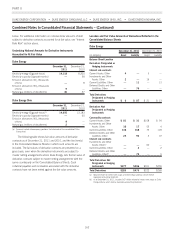
Investments in Equity Method Unconsolidated Affiliates
As of:
December 31, 2011 December 31, 2010
(in millions) Domestic International Total Domestic International Total
U.S. Franchised Electric and Gas $5 $— $5 $5 $— $5
Commercial Power 188 — 188 174 1 175
International Energy —9191—8383
Other 167 9 176 173 8 181
$360 $100 $460 $352 $92 $444
Equity in Earnings of Equity Method Unconsolidated Affiliates
For the Years Ended:
December 31, 2011 December 31, 2010 December 31, 2009
(in millions) Domestic International Total(a) Domestic International Total(a) Domestic International Total(a)
U.S. Franchised Electric and Gas $— $— $— $ — $ — $ — $(10) $ — $(10)
Commercial Power 6—67—77—7
International Energy — 145 145 — 102 102 — 72 72
Other 729527—11
$13 $147 $160 $12 $104 $116 $ (3) $73 $ 70
(a) Duke Energy’s share of net earnings from these unconsolidated affiliates is reflected in the Consolidated Statements of Operations as Equity in Earnings of Unconsolidated Affiliates.
During the years ended December 31, 2011, 2010 and 2009,
Duke Energy received distributions from equity investments of $149
million, $111 million and $83 million, respectively, which are
included in Other assets within Cash Flows from Operating Activities
on the Consolidated Statements of Cash Flows.
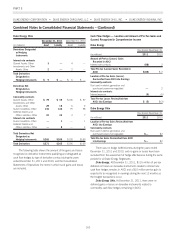
Summarized Combined Financial Information of Equity Method
Unconsolidated Affiliates
As of December 31,
(in millions) 2011 2010
Balance Sheet
Current assets $492 $ 413
Non-current assets 1,599 1,599
Current liabilities (267) (242)
Non-current liabilities (225) (145)
Net assets $1,599 $1,625
For the Years Ended
December 31,
(in millions) 2011 2010 2009
Income Statement
Operating revenues $1,615 $1,385 $1,509
Operating expenses 865 924 1,252
Net income 607 430 257
Other Investments.
Commercial Power had an interest in South Houston Green
Power, L.P. (SHGP), which is a cogeneration facility containing three
combustion turbines in Texas City, Texas. Although Duke Energy
owned a significant portion of SHGP, it was not consolidated as Duke
Energy did not hold a majority voting control or have the ability to
exercise control over SHGP, nor was Duke Energy the primary
beneficiary.
156