Duke Energy 2011 Annual Report Download - page 169
Download and view the complete annual report
Please find page 169 of the 2011 Duke Energy annual report below. You can navigate through the pages in the report by either clicking on the pages listed below, or by using the keyword search tool below to find specific information within the annual report.-
 1
1 -
2
-
3
-
4
-
5
-
6
-
7
-
8
-
9
-
10
-
11
-
12
-
13
-
14
-
15
-
16
-
17
-
18
-
19
-
20
-
21
-
22
-
23
-
24
-
25
-
26
-
27
-
28
-
29
-
30
-
31
-
32
-
33
-
34
-
35
-
36
-
37
-
38
-
39
-
40
-
41
-
42
-
43
-
44
-
45
-
46
-
47
-
48
-
49
-
50
-
51
-
52
-
53
-
54
-
55
-
56
-
57
-
58
-
59
-
60
-
61
-
62
-
63
-
64
-
65
-
66
-
67
-
68
-
69
-
70
-
71
-
72
-
73
-
74
-
75
-
76
-
77
-
78
-
79
-
80
-
81
-
82
-
83
-
84
-
85
-
86
-
87
-
88
-
89
-
90
-
91
-
92
-
93
-
94
-
95
-
96
-
97
-
98
-
99
-
100
-
101
-
102
-
103
-
104
-
105
-
106
-
107
-
108
-
109
-
110
-
111
-
112
-
113
-
114
-
115
-
116
-
117
-
118
-
119
-
120
-
121
-
122
-
123
-
124
-
125
-
126
-
127
-
128
-
129
-
130
-
131
-
132
-
133
-
134
-
135
-
136
-
137
-
138
-
139
-
140
-
141
-
142
-
143
-
144
-
145
-
146
-
147
-
148
-
149
-
150
-
151
-
152
-
153
-
154
-
155
-
156
-
157
-
158
-
 159
159 -
 160
160 -
 161
161 -
 162
162 -
 163
163 -
 164
164 -
 165
165 -
 166
166 -
 167
167 -
 168
168 -
 169
169 -
 170
170 -
 171
171 -
 172
172 -
 173
173 -
 174
174 -
 175
175 -
 176
176 -
 177
177 -
 178
178 -
 179
179 -
180
-
181
-
182
-
183
-
184
-
185
-
186
-
187
-
188
-
189
-
190
-
191
-
192
-
193
-
194
-
195
-
196
-
197
-
198
-
199
-
200
-
201
-
202
-
203
-
204
-
205
-
206
-
207
-
208
-
209
-
210
-
211
-
212
-
213
-
214
-
215
-
216
-
217
-
218
-
219
-
220
-
221
-
222
-
223
-
224
-
225
-
226
-
227
-
228
-
229
-
230
-
231
-
232
-
233
-
234
-
235
-
236
-
237
-
238
-
239
-
240
-
241
-
242
-
243
-
244
-
245
-
246
-
247
-
248
-
249
-
250
-
251
-
252
-
253
-
254
-
255
-
256
-
257
-
258
-
259
-
260
-
261
-
262
-
263
-
264
-
265
-
266
-
267
-
268
-
269
-
270
-
271
-
272
-
273
-
274
-
275
 |
 |

PART II
DUKE ENERGY CORPORATION •DUKE ENERGY CAROLINAS, LLC •DUKE ENERGY OHIO, INC. •DUKE ENERGY INDIANA, INC.
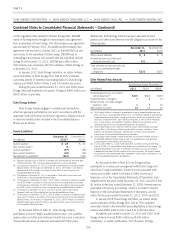
Combined Notes to Consolidated Financial Statements – (Continued)
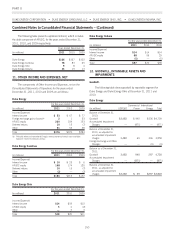
10. PROPERTY, PLANT AND EQUIPMENT
December 31, 2011
(in millions)
Estimated
Useful Life Duke Energy
Duke Energy
Carolinas
Duke Energy
Ohio
Duke Energy
Indiana
(Years)
Land — $ 745 $ 372 $ 135 $ 88
Plant — Regulated
Electric generation, distribution and transmission(a) 8 – 125 38,330 26,466 3,595 8,269
Natural gas transmission and distribution(a) 12 – 60 1,927 — 1,927 —
Other buildings and improvements(a) 25 –100 672 428 106 138
Plant — Unregulated
Electric generation, distribution and transmission(a) 8 – 100 5,464 — 3,997 —
Other buildings and improvements(a) 18 – 40 2,095 — 192 —
Nuclear fuel — 1,213 1,213 — —
Equipment(a) 3 – 33 863 248 168 134
Construction in process(a) — 7,664 3,774 255 2,992
Other(a) 5 – 33 2,477 499 257 170
Total property, plant and equipment 61,450 33,000 10,632 11,791
Total accumulated depreciation — regulated(b),(c) (16,630) (11,349) (1,916) (3,393)
Total accumulated depreciation — unregulated(c)(d) (2,159) — (678) —
Total net property, plant and equipment $ 42,661 $ 21,651 $ 8,038 $ 8,398
(a) Includes capitalized leases of $444 million, $53 million, $82 million, and $33 million at Duke Energy, Duke Energy Carolinas, Duke Energy Ohio, and Duke Energy Indiana,
respectively.
(b) Includes $578 million of accumulated amortization of nuclear fuel at Duke Energy and Duke Energy Carolinas.
(c) Includes accumulated amortization of capitalized leases of $28 million, an insignificant amount, $11 million and $6 million at Duke Energy, Duke Energy Carolinas, Duke Energy Ohio,
and Duke Energy Indiana, respectively.
(d) Includes accumulated depreciation of VIEs of $62 million at December 31, 2011 at Duke Energy.
December 31, 2010
(in millions)
Estimated
Useful Life Duke Energy
Duke Energy
Carolinas
Duke Energy
Ohio
Duke Energy
Indiana
(Years)
Land(a) — $ 743 $ 357 $ 133 $ 89
Plant — Regulated
Electric generation, distribution and transmission(a) 8 – 125 36,744 24,980 3,483 8,282
Natural gas transmission and distribution(a) 12 – 60 1,815 — 1,815 —
Other buildings and improvements(a) 25 –100 610 366 111 132
Plant — Unregulated
Electric generation, distribution and transmission(a) 8 – 100 5,256 — 3,960 —
Other buildings and improvements(a) 20 – 90 2,108 1 188 —
Nuclear fuel — 1,176 1,176 — —
Equipment(a) 3 – 33 718 166 147 128
Construction in process(a) — 7,015 3,677 182 2,426
Other(a) 5 – 33 2,354 468 240 156
Total property, plant and equipment 58,539 31,191 10,259 11,213
Total accumulated depreciation — regulated(b),(c) (16,273) (11,126) (1,832) (3,341)
Total accumulated depreciation — unregulated(c)(d) (1,922) — (579) —
Total net property, plant and equipment $ 40,344 $ 20,065 $ 7,848 $ 7,872
(a) Includes capitalized leases of $414 million, $134 million, and $53 million at Duke Energy, Duke Energy Ohio, and Duke Energy Indiana, respectively.
(b) Includes $667 million of accumulated amortization of nuclear fuel at Duke Energy and Duke Energy Carolinas.
(c) Includes accumulated amortization of capitalized leases of $31 million, $17 million and $10 million at Duke Energy, Duke Energy Ohio, and Duke Energy Indiana, respectively.
(d) Includes accumulated depreciation of VIEs of $45 million at December 31, 2010 at Duke Energy.
149