Duke Energy 2011 Annual Report Download - page 72
Download and view the complete annual report
Please find page 72 of the 2011 Duke Energy annual report below. You can navigate through the pages in the report by either clicking on the pages listed below, or by using the keyword search tool below to find specific information within the annual report.-
 1
1 -
2
-
3
-
4
-
5
-
6
-
7
-
8
-
9
-
10
-
11
-
12
-
13
-
14
-
15
-
16
-
17
-
18
-
19
-
20
-
21
-
22
-
23
-
24
-
25
-
26
-
27
-
28
-
29
-
30
-
31
-
32
-
33
-
34
-
35
-
36
-
37
-
38
-
39
-
40
-
41
-
42
-
43
-
44
-
45
-
46
-
47
-
48
-
49
-
50
-
51
-
52
-
53
-
54
-
55
-
56
-
57
-
58
-
59
-
60
-
61
-
 62
62 -
 63
63 -
 64
64 -
 65
65 -
 66
66 -
 67
67 -
 68
68 -
 69
69 -
 70
70 -
 71
71 -
 72
72 -
 73
73 -
 74
74 -
 75
75 -
 76
76 -
 77
77 -
 78
78 -
 79
79 -
 80
80 -
 81
81 -
 82
82 -
83
-
84
-
85
-
86
-
87
-
88
-
89
-
90
-
91
-
92
-
93
-
94
-
95
-
96
-
97
-
98
-
99
-
100
-
101
-
102
-
103
-
104
-
105
-
106
-
107
-
108
-
109
-
110
-
111
-
112
-
113
-
114
-
115
-
116
-
117
-
118
-
119
-
120
-
121
-
122
-
123
-
124
-
125
-
126
-
127
-
128
-
129
-
130
-
131
-
132
-
133
-
134
-
135
-
136
-
137
-
138
-
139
-
140
-
141
-
142
-
143
-
144
-
145
-
146
-
147
-
148
-
149
-
150
-
151
-
152
-
153
-
154
-
155
-
156
-
157
-
158
-
159
-
160
-
161
-
162
-
163
-
164
-
165
-
166
-
167
-
168
-
169
-
170
-
171
-
172
-
173
-
174
-
175
-
176
-
177
-
178
-
179
-
180
-
181
-
182
-
183
-
184
-
185
-
186
-
187
-
188
-
189
-
190
-
191
-
192
-
193
-
194
-
195
-
196
-
197
-
198
-
199
-
200
-
201
-
202
-
203
-
204
-
205
-
206
-
207
-
208
-
209
-
210
-
211
-
212
-
213
-
214
-
215
-
216
-
217
-
218
-
219
-
220
-
221
-
222
-
223
-
224
-
225
-
226
-
227
-
228
-
229
-
230
-
231
-
232
-
233
-
234
-
235
-
236
-
237
-
238
-
239
-
240
-
241
-
242
-
243
-
244
-
245
-
246
-
247
-
248
-
249
-
250
-
251
-
252
-
253
-
254
-
255
-
256
-
257
-
258
-
259
-
260
-
261
-
262
-
263
-
264
-
265
-
266
-
267
-
268
-
269
-
270
-
271
-
272
-
273
-
274
-
275
 |
 |

PART II
agreements include combined base rate increases of approximately
$400 million that will be reflected in 2012 earnings.
Duke Energy Carolinas plans to file rate cases in North Carolina
and South Carolina during 2012. These planned rates cases are
needed to recover investments in Duke Energy Carolinas’ ongoing
infrastructure modernization projects and operating costs. Duke
Energy Carolinas’ earnings could be adversely impacted if these rate
cases are denied or delayed by either of the state regulatory
commissions.
DUKE ENERGY OHIO
INTRODUCTION
Management’s Discussion and Analysis should be read in
conjunction with the accompanying Consolidated Financial
Statements and Notes for the years ended December 31, 2011,
2010 and 2009.
BASIS OF PRESENTATION
The results of operations and variance discussion for Duke
Energy Ohio is presented in a reduced disclosure format in
accordance with General Instruction (I)(2)(a) of Form 10-K.
RESULTS OF OPERATIONS
Results of Operations and Variances
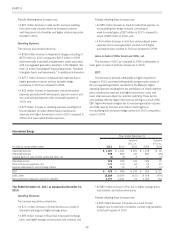
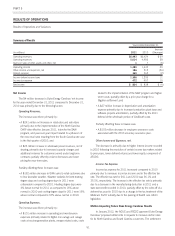
Summary of Results
Years Ended December 31,
(in millions) 2011 2010
Increase
(Decrease)
Operating revenues $3,181 $3,329 $(148)
Operating expenses 2,811 3,557 (746)
Gains on sales of other assets and other, net 532
Operating income (loss) 375 (225) 600
Other income and expenses, net 19 25 (6)
Interest expense 104 109 (5)
Income before income taxes 290 (309) 599
Income tax expense 96 132 (36)
Net income (loss) $ 194 $ (441) $ 635
Net Income
The $635 million increase in Duke Energy Ohio’s net income
was primarily due to the following factors:
Operating Revenues.
Thedecreasewasdueprimarilyto:
• A $204 million decrease in retail electric revenues resulting
from lower sales volumes driven by increased customer
switching levels net of higher retail pricing under the ESP in
2011;
• A $75 million decrease in retail electric revenues resulting
from the expiration of the Ohio electric Regulatory Transition
Charge for non-residential customers;
• A $63 million decrease in regulated fuel revenues driven
primarily by reduced sales volumes and lower natural gas costs;
• A $39 million decrease related to less favorable weather
conditions in 2011 compared to 2010; and
• A $23 million decrease in net mark-to-market revenues on
non-qualifying power and capacity hedge contracts, consisting
of mark-to-market gains of $7 million in 2011 compared to
gains of $30 million in 2010.
Partially offsetting these decreases were:
• A $246 million increase in wholesale electric revenues due to
higher generation volumes net of lower pricing and lower margin
earned from participation in wholesale auctions in 2011.
Operating Expenses.
Thedecreasewasdueprimarilyto:
• A $749 million decrease in impairment charges primarily
related to a $677 million impairment of goodwill and a $160
million impairment of certain generation assets in 2010
compared to a $79 million impairment in 2011 to write down
the carrying value of excess emission allowances. See Note 12
to the Consolidated Financial Statements, “Goodwill,
Intangible Assets and Impairments,” for additional information;
52