Duke Energy 2011 Annual Report Download - page 106
Download and view the complete annual report
Please find page 106 of the 2011 Duke Energy annual report below. You can navigate through the pages in the report by either clicking on the pages listed below, or by using the keyword search tool below to find specific information within the annual report.-
 1
1 -
2
-
3
-
4
-
5
-
6
-
7
-
8
-
9
-
10
-
11
-
12
-
13
-
14
-
15
-
16
-
17
-
18
-
19
-
20
-
21
-
22
-
23
-
24
-
25
-
26
-
27
-
28
-
29
-
30
-
31
-
32
-
33
-
34
-
35
-
36
-
37
-
38
-
39
-
40
-
41
-
42
-
43
-
44
-
45
-
46
-
47
-
48
-
49
-
50
-
51
-
52
-
53
-
54
-
55
-
56
-
57
-
58
-
59
-
60
-
61
-
62
-
63
-
64
-
65
-
66
-
67
-
68
-
69
-
70
-
71
-
72
-
73
-
74
-
75
-
76
-
77
-
78
-
79
-
80
-
81
-
82
-
83
-
84
-
85
-
86
-
87
-
88
-
89
-
90
-
91
-
92
-
93
-
94
-
95
-
 96
96 -
 97
97 -
 98
98 -
 99
99 -
 100
100 -
 101
101 -
 102
102 -
 103
103 -
 104
104 -
 105
105 -
 106
106 -
 107
107 -
 108
108 -
 109
109 -
 110
110 -
 111
111 -
 112
112 -
 113
113 -
 114
114 -
 115
115 -
 116
116 -
117
-
118
-
119
-
120
-
121
-
122
-
123
-
124
-
125
-
126
-
127
-
128
-
129
-
130
-
131
-
132
-
133
-
134
-
135
-
136
-
137
-
138
-
139
-
140
-
141
-
142
-
143
-
144
-
145
-
146
-
147
-
148
-
149
-
150
-
151
-
152
-
153
-
154
-
155
-
156
-
157
-
158
-
159
-
160
-
161
-
162
-
163
-
164
-
165
-
166
-
167
-
168
-
169
-
170
-
171
-
172
-
173
-
174
-
175
-
176
-
177
-
178
-
179
-
180
-
181
-
182
-
183
-
184
-
185
-
186
-
187
-
188
-
189
-
190
-
191
-
192
-
193
-
194
-
195
-
196
-
197
-
198
-
199
-
200
-
201
-
202
-
203
-
204
-
205
-
206
-
207
-
208
-
209
-
210
-
211
-
212
-
213
-
214
-
215
-
216
-
217
-
218
-
219
-
220
-
221
-
222
-
223
-
224
-
225
-
226
-
227
-
228
-
229
-
230
-
231
-
232
-
233
-
234
-
235
-
236
-
237
-
238
-
239
-
240
-
241
-
242
-
243
-
244
-
245
-
246
-
247
-
248
-
249
-
250
-
251
-
252
-
253
-
254
-
255
-
256
-
257
-
258
-
259
-
260
-
261
-
262
-
263
-
264
-
265
-
266
-
267
-
268
-
269
-
270
-
271
-
272
-
273
-
274
-
275
 |
 |

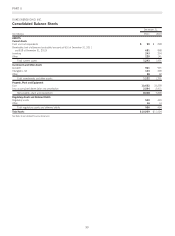
PART II
DUKE ENERGY CAROLINAS, LLC
Consolidated Statements of Cash Flows
Years Ended December 31,
(In millions) 2011 2010 2009
CASH FLOWS FROM OPERATING ACTIVITIES
Net income $ 834 $838$702
Adjustments to reconcile net income to net cash provided by operating activities:
Depreciation and amortization (including amortization of nuclear fuel) 1,020 984 873
Equity component of AFUDC (168) (174) (125)
Gains on sales of other assets and other, net (1) (7) (24)
Impairment charges 12 ——
Deferred income taxes 564 456 600
Contributions to qualified pension plans (33) (158) (158)
Accrued pension and other post-retirement benefit costs 32 34 13
(Increase) decrease in
Net realized and unrealized mark-to-market and hedging transactions (91) 11
Receivables 110 24 235
Inventory (177) 134 (183)
Other current assets 144 (55) 44
Increase (decrease) in
Accounts payable 81 111 138
Taxes accrued 12 (23) 31
Other current liabilities (170) 442
Other assets (46) 19 (34)
Other liabilities (249) (158) (230)
Net cash provided by operating activities 1,874 2,030 1,925
CASH FLOWS FROM INVESTING ACTIVITIES
Capital expenditures (2,272) (2,280) (2,236)
Purchases of available-for-sale securities (2,227) (1,045) (2,118)
Proceeds from sales and maturities of available-for-sale securities 2,179 1,066 2,094
Sales of emission allowances 2723
Change in restricted cash 2715
Notes due from affiliate (584) 250 (251)
Other (15) (7) (17)
Net cash used in investing activities (2,915) (2,002) (2,490)
CASH FLOWS FROM FINANCING ACTIVITIES
Proceeds from the issuance of long-term debt 1,498 692 904
Payments for the redemption of long-term debt (7) (607) (511)
Capital contribution from parent —— 250
Distributions to parent (299) (350) —
Other (15) (4) (7)
Net cash provided by (used in) financing activities 1,177 (269) 636
Net increase (decrease) in cash and cash equivalents 136 (241) 71
Cash and cash equivalents at beginning of period 153 394 323
Cash and cash equivalents at end of period $ 289 $153 $394
Supplemental Disclosures
Cash paid for interest, net of amount capitalized $ 337 $342 $312
Cash (refunded) paid for income taxes $ (223) $ 69 $ (317)
Significant non-cash transactions:
Accrued capital expenditures $ 209 $181$208
Allocation of net pension and other post-retirement assets from parent $—$146$ —
See Notes to Consolidated Financial Statements
86