Duke Energy 2011 Annual Report Download - page 73
Download and view the complete annual report
Please find page 73 of the 2011 Duke Energy annual report below. You can navigate through the pages in the report by either clicking on the pages listed below, or by using the keyword search tool below to find specific information within the annual report.-
 1
1 -
2
-
3
-
4
-
5
-
6
-
7
-
8
-
9
-
10
-
11
-
12
-
13
-
14
-
15
-
16
-
17
-
18
-
19
-
20
-
21
-
22
-
23
-
24
-
25
-
26
-
27
-
28
-
29
-
30
-
31
-
32
-
33
-
34
-
35
-
36
-
37
-
38
-
39
-
40
-
41
-
42
-
43
-
44
-
45
-
46
-
47
-
48
-
49
-
50
-
51
-
52
-
53
-
54
-
55
-
56
-
57
-
58
-
59
-
60
-
61
-
62
-
 63
63 -
 64
64 -
 65
65 -
 66
66 -
 67
67 -
 68
68 -
 69
69 -
 70
70 -
 71
71 -
 72
72 -
 73
73 -
 74
74 -
 75
75 -
 76
76 -
 77
77 -
 78
78 -
 79
79 -
 80
80 -
 81
81 -
 82
82 -
 83
83 -
84
-
85
-
86
-
87
-
88
-
89
-
90
-
91
-
92
-
93
-
94
-
95
-
96
-
97
-
98
-
99
-
100
-
101
-
102
-
103
-
104
-
105
-
106
-
107
-
108
-
109
-
110
-
111
-
112
-
113
-
114
-
115
-
116
-
117
-
118
-
119
-
120
-
121
-
122
-
123
-
124
-
125
-
126
-
127
-
128
-
129
-
130
-
131
-
132
-
133
-
134
-
135
-
136
-
137
-
138
-
139
-
140
-
141
-
142
-
143
-
144
-
145
-
146
-
147
-
148
-
149
-
150
-
151
-
152
-
153
-
154
-
155
-
156
-
157
-
158
-
159
-
160
-
161
-
162
-
163
-
164
-
165
-
166
-
167
-
168
-
169
-
170
-
171
-
172
-
173
-
174
-
175
-
176
-
177
-
178
-
179
-
180
-
181
-
182
-
183
-
184
-
185
-
186
-
187
-
188
-
189
-
190
-
191
-
192
-
193
-
194
-
195
-
196
-
197
-
198
-
199
-
200
-
201
-
202
-
203
-
204
-
205
-
206
-
207
-
208
-
209
-
210
-
211
-
212
-
213
-
214
-
215
-
216
-
217
-
218
-
219
-
220
-
221
-
222
-
223
-
224
-
225
-
226
-
227
-
228
-
229
-
230
-
231
-
232
-
233
-
234
-
235
-
236
-
237
-
238
-
239
-
240
-
241
-
242
-
243
-
244
-
245
-
246
-
247
-
248
-
249
-
250
-
251
-
252
-
253
-
254
-
255
-
256
-
257
-
258
-
259
-
260
-
261
-
262
-
263
-
264
-
265
-
266
-
267
-
268
-
269
-
270
-
271
-
272
-
273
-
274
-
275
 |
 |

PART II
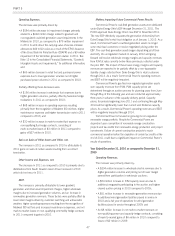
• A $107 million decrease in retail fuel and purchased power
expenses due to lower generation volumes driven by increased
customer switching levels in 2011 compared to 2010;
• A $64 million decrease in depreciation and amortization costs
primarily due to decreased regulatory transition charge
amortization;
• A $63 million decrease in regulated fuel expense primarily due
to reduced sales volumes and lower natural gas costs;
• A $24 million decrease in employee severance costs related to
the 2010 voluntary severance plan and the consolidation of
certain corporate office functions from the Midwest to
Charlotte, North Carolina.
Partially offsetting these decreases were:
• A $159 million increase in wholesale fuel expenses due to
higher generation volumes;
• A $72 million increase in operating and maintenance
expenses primarily from the recognition of Midwest ISO exit
fees and higher maintenance expenses; and
• A $29 million increase in mark-to-market fuel expense on
non-qualifying fuel hedge contracts, consisting of
mark-to-market losses of $3 million in 2011 compared to
gains of $26 million in 2010.
Other Income and Expenses, net.
The decrease in 2011 compared to 2010 is primarily
attributable to reduced interest income accrued for uncertain income
tax positions.
Income Tax Expense.
Income tax expense for 2011 increased compared to 2010
primarily due to increases in pre-tax income and in the effective tax
rate. The effective tax rate in 2011 was 33.1% compared to an
effective tax rate for the same period in 2010 of (43.0%). The
change in the effective tax rate is primarily due to a $677 million
non-deductible impairment of goodwill in 2010, as discussed above.
Matters Impacting Future Duke Energy Ohio Results
Duke Energy Ohio operated under an ESP that expired on
December 31, 2011. The PUCO approved Duke Energy Ohio’s new
ESP in November 2011. The new ESP effectively separates the
generation of electricity from Duke Energy Ohio’s retail load obligation
as of January 1, 2012. Duke Energy Ohio’s retail load obligation is
satisfied through competitive auctions, the costs of which are
recovered from customers. Duke Energy Ohio now earns retail margin
on the transmission and distribution of electricity only and not on the
cost of the underlying energy. Duke Energy Ohio’s coal-fired
generation assets no longer serve retail load customers or receive
negotiated pricing under the ESP. The coal-fired generation assets
began dispatching all of their electricity into unregulated markets in
January 2012 and going forward will receive wholesale energy
margins and capacity revenues from PJM at rates currently below
those previously collected under the prior ESP. These lower energy
margins and capacity revenues are expected to be partially offset by a
non-bypassable stability charge collected from Duke Energy Ohio’s
retail customers through 2014. As a result, Duke Energy’s operating
revenues and net income will be negatively impacted.
Duke Energy Ohio’s gas-fired non-regulated generation assets
earn capacity revenues from PJM. PJM capacity prices are
determined through an auction process for planning years from June
through May of the following year and are conducted approximately
three years in advance of the capacity delivery period. Capacity prices
for periods beginning June 2011 and continuing through May 2014,
will be significantly lower than current and historical capacity prices.
As a result, Duke Energy Ohio’s operating revenues and net income
will be negatively impacted through 2014.
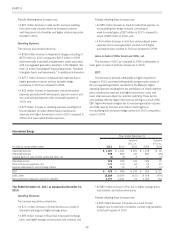
DUKE ENERGY INDIANA
INTRODUCTION
Management’s Discussion and Analysis should be read in
conjunction with the accompanying Consolidated Financial
Statements and Notes for the years ended December 31, 2011,
2010 and 2009.
BASIS OF PRESENTATION
The results of operations and variance discussion for Duke
Energy Indiana is presented in a reduced disclosure format in
accordance with General Instruction (I)(2)(a) of Form 10-K.
53