Duke Energy 2011 Annual Report Download - page 139
Download and view the complete annual report
Please find page 139 of the 2011 Duke Energy annual report below. You can navigate through the pages in the report by either clicking on the pages listed below, or by using the keyword search tool below to find specific information within the annual report.-
 1
1 -
 2
2 -
 3
3 -
 4
4 -
 5
5 -
 6
6 -
 7
7 -
 8
8 -
 9
9 -
 10
10 -
 11
11 -
 12
12 -
 13
13 -
 14
14 -
 15
15 -
 16
16 -
 17
17 -
 18
18 -
 19
19 -
 20
20 -
 21
21 -
 22
22 -
 23
23 -
 24
24 -
 25
25 -
 26
26 -
 27
27 -
 28
28 -
 29
29 -
 30
30 -
 31
31 -
 32
32 -
 33
33 -
 34
34 -
 35
35 -
 36
36 -
 37
37 -
 38
38 -
 39
39 -
 40
40 -
 41
41 -
 42
42 -
 43
43 -
 44
44 -
 45
45 -
 46
46 -
 47
47 -
 48
48 -
 49
49 -
 50
50 -
 51
51 -
 52
52 -
 53
53 -
 54
54 -
 55
55 -
 56
56 -
 57
57 -
 58
58 -
 59
59 -
 60
60 -
 61
61 -
 62
62 -
 63
63 -
 64
64 -
 65
65 -
 66
66 -
 67
67 -
 68
68 -
 69
69 -
 70
70 -
 71
71 -
 72
72 -
 73
73 -
 74
74 -
 75
75 -
 76
76 -
 77
77 -
 78
78 -
 79
79 -
 80
80 -
 81
81 -
 82
82 -
 83
83 -
 84
84 -
 85
85 -
 86
86 -
 87
87 -
 88
88 -
 89
89 -
 90
90 -
 91
91 -
 92
92 -
 93
93 -
 94
94 -
 95
95 -
 96
96 -
 97
97 -
 98
98 -
 99
99 -
 100
100 -
 101
101 -
 102
102 -
 103
103 -
 104
104 -
 105
105 -
 106
106 -
 107
107 -
 108
108 -
 109
109 -
 110
110 -
 111
111 -
 112
112 -
 113
113 -
 114
114 -
 115
115 -
 116
116 -
 117
117 -
 118
118 -
 119
119 -
 120
120 -
 121
121 -
 122
122 -
 123
123 -
 124
124 -
 125
125 -
 126
126 -
 127
127 -
 128
128 -
 129
129 -
 130
130 -
 131
131 -
 132
132 -
 133
133 -
 134
134 -
 135
135 -
 136
136 -
 137
137 -
 138
138 -
 139
139 -
 140
140 -
 141
141 -
 142
142 -
 143
143 -
 144
144 -
 145
145 -
 146
146 -
 147
147 -
 148
148 -
 149
149 -
 150
150 -
 151
151 -
 152
152 -
 153
153 -
 154
154 -
 155
155 -
 156
156 -
 157
157 -
 158
158 -
 159
159 -
 160
160 -
 161
161 -
 162
162 -
 163
163 -
 164
164 -
 165
165 -
 166
166 -
 167
167 -
 168
168 -
 169
169 -
 170
170 -
 171
171 -
 172
172 -
 173
173 -
 174
174 -
 175
175 -
 176
176 -
 177
177 -
 178
178 -
 179
179 -
 180
180 -
 181
181 -
 182
182 -
 183
183 -
 184
184 -
 185
185 -
 186
186 -
 187
187 -
 188
188 -
 189
189 -
 190
190 -
 191
191 -
 192
192 -
 193
193 -
 194
194 -
 195
195 -
 196
196 -
 197
197 -
 198
198 -
 199
199 -
 200
200 -
 201
201 -
 202
202 -
 203
203 -
 204
204 -
 205
205 -
 206
206 -
 207
207 -
 208
208 -
 209
209 -
 210
210 -
 211
211 -
 212
212 -
 213
213 -
 214
214 -
 215
215 -
 216
216 -
 217
217 -
 218
218 -
 219
219 -
 220
220 -
 221
221 -
 222
222 -
 223
223 -
 224
224 -
 225
225 -
 226
226 -
 227
227 -
 228
228 -
 229
229 -
 230
230 -
 231
231 -
 232
232 -
 233
233 -
 234
234 -
 235
235 -
 236
236 -
 237
237 -
 238
238 -
 239
239 -
 240
240 -
 241
241 -
 242
242 -
 243
243 -
 244
244 -
 245
245 -
 246
246 -
 247
247 -
 248
248 -
 249
249 -
 250
250 -
 251
251 -
 252
252 -
 253
253 -
 254
254 -
 255
255 -
 256
256 -
 257
257 -
 258
258 -
 259
259 -
 260
260 -
 261
261 -
 262
262 -
 263
263 -
 264
264 -
 265
265 -
 266
266 -
 267
267 -
 268
268 -
 269
269 -
 270
270 -
 271
271 -
 272
272 -
 273
273 -
 274
274 -
 275
275
 |
 |

PART II
DUKE ENERGY CORPORATION •DUKE ENERGY CAROLINAS, LLC •DUKE ENERGY OHIO, INC. •DUKE ENERGY INDIANA, INC.
Combined Notes to Consolidated Financial Statements – (Continued)
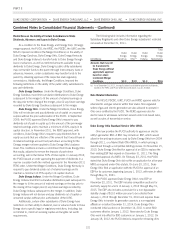
Duke Energy Registrants’ Regulatory Assets and Liabilities:
As of December 31, 2011
(in millions)
Duke
Energy
Duke Energy
Carolinas
Duke Energy
Ohio
Duke Energy
Indiana
Recovery/Refund
Period Ends(k)
Regulatory Assets(a)
Vacation accrual $ 150 $ 70 $ 7 $ 13 2012
Under-recovery of fuel costs 38 — 10 28 2012
Hedge costs and other deferrals 4 3 1 — 2012
Post-in-service carrying costs and deferred operating expense(c)(l) 31 28 — 3 2012
Over-distribution of Bulk Power Marketing sharing 41 41 — — 2012
Demand side management costs (DSM costs)/Energy Efficiency 43 25 — 18 2012
Regional Transmission Organization (RTO) costs(m) 17 5 — 12 2012
SmartGrid 9 — 9 — 2012
Gasification services agreement buyout costs 25 — — 25 2012
Other 16 — 1 15 2012
Total Current Regulatory Assets(d) 374 172 28 114
Net regulatory asset related to income taxes(e) 892 668 77 147 (h)
Accrued pension and post-retirement 1,726 734 212 314 (b)
ARO costs 191 191 — — 2043
Gasification services agreement buyout costs 88 — — 88 2018
Deferred debt expense(e) 122 98 8 16 2041
Post-in-service carrying costs and deferred operating expense(c)(l) 119 31 16 72 (h)
Under-recovery of fuel costs 13 13 — — 2013
Hedge costs and other deferrals 166 91 8 67 (b)
Storm cost deferrals 18 — 18 — (b)
Manufactured gas plant environmental costs 69 — 69 — (b)
Smart Grid 32 — 32 — (b)
Gallagher Units 1 & 3 73 — — 73 (b)
RTO costs(m) 80 13 74 — (b)
DSM costs/Energy Efficiency 38 38 — — (b)
Other 45 17 6 21 (b)
Total Non-Current Regulatory Assets 3,672 1,894 520 798
Total Regulatory Assets $4,046 $2,066 $548 $912
Regulatory Liabilities(a)
Nuclear property and insurance reserves $2 $2 $— $— 2012
DSM costs(f) 41 41 — — 2012
Gas purchase costs 20 — 20 — 2012
Over-recovery of fuel costs(f) 6 6 — — 2012
Other 18 13 2 3 2012
Total Current Regulatory Liabilities(g) 87 62 22 3
Removal costs(e) 2,586 1,770 230 590 (j)
Nuclear property and liability reserves 86 86 — — 2043
DSM costs(f)/Energy Efficiency 27 10 17 — (i)
Accrued pension and other post-retirement benefits 117 — 19 70 (b)
Commodity contract termination settlement 23 — — 23 2014
Injuries and damages reserve(e) 38 38 — — (b)
Hedge costs and other deferrals(e) 12 — — — 2016
Other 30 24 7 — (b)
Total Non-Current Regulatory Liabilities 2,919 1,928 273 683
Total Regulatory Liabilities $3,006 $1,990 $295 $686 3
119
