Duke Energy 2011 Annual Report Download - page 100
Download and view the complete annual report
Please find page 100 of the 2011 Duke Energy annual report below. You can navigate through the pages in the report by either clicking on the pages listed below, or by using the keyword search tool below to find specific information within the annual report.-
 1
1 -
2
-
3
-
4
-
5
-
6
-
7
-
8
-
9
-
10
-
11
-
12
-
13
-
14
-
15
-
16
-
17
-
18
-
19
-
20
-
21
-
22
-
23
-
24
-
25
-
26
-
27
-
28
-
29
-
30
-
31
-
32
-
33
-
34
-
35
-
36
-
37
-
38
-
39
-
40
-
41
-
42
-
43
-
44
-
45
-
46
-
47
-
48
-
49
-
50
-
51
-
52
-
53
-
54
-
55
-
56
-
57
-
58
-
59
-
60
-
61
-
62
-
63
-
64
-
65
-
66
-
67
-
68
-
69
-
70
-
71
-
72
-
73
-
74
-
75
-
76
-
77
-
78
-
79
-
80
-
81
-
82
-
83
-
84
-
85
-
86
-
87
-
88
-
89
-
 90
90 -
 91
91 -
 92
92 -
 93
93 -
 94
94 -
 95
95 -
 96
96 -
 97
97 -
 98
98 -
 99
99 -
 100
100 -
 101
101 -
 102
102 -
 103
103 -
 104
104 -
 105
105 -
 106
106 -
 107
107 -
 108
108 -
 109
109 -
 110
110 -
111
-
112
-
113
-
114
-
115
-
116
-
117
-
118
-
119
-
120
-
121
-
122
-
123
-
124
-
125
-
126
-
127
-
128
-
129
-
130
-
131
-
132
-
133
-
134
-
135
-
136
-
137
-
138
-
139
-
140
-
141
-
142
-
143
-
144
-
145
-
146
-
147
-
148
-
149
-
150
-
151
-
152
-
153
-
154
-
155
-
156
-
157
-
158
-
159
-
160
-
161
-
162
-
163
-
164
-
165
-
166
-
167
-
168
-
169
-
170
-
171
-
172
-
173
-
174
-
175
-
176
-
177
-
178
-
179
-
180
-
181
-
182
-
183
-
184
-
185
-
186
-
187
-
188
-
189
-
190
-
191
-
192
-
193
-
194
-
195
-
196
-
197
-
198
-
199
-
200
-
201
-
202
-
203
-
204
-
205
-
206
-
207
-
208
-
209
-
210
-
211
-
212
-
213
-
214
-
215
-
216
-
217
-
218
-
219
-
220
-
221
-
222
-
223
-
224
-
225
-
226
-
227
-
228
-
229
-
230
-
231
-
232
-
233
-
234
-
235
-
236
-
237
-
238
-
239
-
240
-
241
-
242
-
243
-
244
-
245
-
246
-
247
-
248
-
249
-
250
-
251
-
252
-
253
-
254
-
255
-
256
-
257
-
258
-
259
-
260
-
261
-
262
-
263
-
264
-
265
-
266
-
267
-
268
-
269
-
270
-
271
-
272
-
273
-
274
-
275
 |
 |

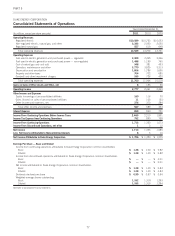
PART II
DUKE ENERGY CORPORATION
Consolidated Statements of Cash Flows
Years Ended December 31,
(In millions) 2011 2010 2009
CASH FLOWS FROM OPERATING ACTIVITIES
Net income $ 1,714 $1,323 $1,085
Adjustments to reconcile net income to net cash provided by operating activities
Depreciation and amortization (including amortization of nuclear fuel) 2,026 1,994 1,846
Equity component of AFUDC (260) (234) (153)
Gains on sales of other assets (19) (268) (44)
Impairment of goodwill and other long-lived assets 335 738 449
Deferred income taxes 602 741 941
Equity in earnings of unconsolidated affiliates (160) (116) (70)
Contributions to qualified pension plans (200) (400) (800)
Accrued pension and other post-retirement benefit costs 104 117 72
(Increase) decrease in
Net realized and unrealized mark-to-market and hedging transactions (48) 15 4
Receivables 219 (38)
Inventory (247) 198 (298)
Other current assets 185 227 277
Increase (decrease) in
Accounts payable 41 167 (80)
Taxes accrued 27 30 52
Other current liabilities (254) 43 70
Other assets 12 157 144
Other liabilities (188) (240) 6
Net cash provided by operating activities 3,672 4,511 3,463
CASH FLOWS FROM INVESTING ACTIVITIES
Capital expenditures (4,363) (4,803) (4,296)
Investment expenditures (50) (52) (137)
Acquisitions (51) — (124)
Purchases of available-for-sale securities (3,194) (2,166) (3,013)
Proceeds from sales and maturities of available-for-sale securities 3,063 2,261 2,988
Net proceeds from the sales of equity investments and other assets, and sales of and collections on notes
receivable 118 406 70
Purchases of emission allowances (9) (14) (93)
Sales of emission allowances 924 67
Change in restricted cash 22 (75) 58
Other 21 (4) (12)
Net cash used in investing activities (4,434) (4,423) (4,492)
CASH FLOWS FROM FINANCING ACTIVITIES
Proceeds from the:
Issuance of long-term debt 2,570 2,738 4,409
Issuance of common stock related to employee benefit plans 67 302 519
Payments for the redemption of long-term debt (278) (1,647) (1,533)
Notes payable and commercial paper 208 (55) (548)
Distributions to noncontrolling interests (26) (10) (37)
Dividends paid (1,329) (1,284) (1,222)
Other (10) (4) (3)
Net cash provided by financing activities 1,202 40 1,585
Net increase in cash and cash equivalents 440 128 556
Cash and cash equivalents at beginning of period 1,670 1,542 986
Cash and cash equivalents at end of period $ 2,110 $1,670 $1,542
Supplemental Disclosures
Cash paid for interest, net of amount capitalized $ 813 $795$689
Cash paid (refunded) for income taxes $26$ 64 $ (419)
Significant non-cash transactions:
Accrued capital expenditures $ 409 $361$428
Debt associated with the consolidation of variable interest entities $—$342$ —
See Notes to Consolidated Financial Statements
80