Duke Energy 2011 Annual Report Download - page 66
Download and view the complete annual report
Please find page 66 of the 2011 Duke Energy annual report below. You can navigate through the pages in the report by either clicking on the pages listed below, or by using the keyword search tool below to find specific information within the annual report.-
 1
1 -
2
-
3
-
4
-
5
-
6
-
7
-
8
-
9
-
10
-
11
-
12
-
13
-
14
-
15
-
16
-
17
-
18
-
19
-
20
-
21
-
22
-
23
-
24
-
25
-
26
-
27
-
28
-
29
-
30
-
31
-
32
-
33
-
34
-
35
-
36
-
37
-
38
-
39
-
40
-
41
-
42
-
43
-
44
-
45
-
46
-
47
-
48
-
49
-
50
-
51
-
52
-
53
-
54
-
55
-
 56
56 -
 57
57 -
 58
58 -
 59
59 -
 60
60 -
 61
61 -
 62
62 -
 63
63 -
 64
64 -
 65
65 -
 66
66 -
 67
67 -
 68
68 -
 69
69 -
 70
70 -
 71
71 -
 72
72 -
 73
73 -
 74
74 -
 75
75 -
 76
76 -
77
-
78
-
79
-
80
-
81
-
82
-
83
-
84
-
85
-
86
-
87
-
88
-
89
-
90
-
91
-
92
-
93
-
94
-
95
-
96
-
97
-
98
-
99
-
100
-
101
-
102
-
103
-
104
-
105
-
106
-
107
-
108
-
109
-
110
-
111
-
112
-
113
-
114
-
115
-
116
-
117
-
118
-
119
-
120
-
121
-
122
-
123
-
124
-
125
-
126
-
127
-
128
-
129
-
130
-
131
-
132
-
133
-
134
-
135
-
136
-
137
-
138
-
139
-
140
-
141
-
142
-
143
-
144
-
145
-
146
-
147
-
148
-
149
-
150
-
151
-
152
-
153
-
154
-
155
-
156
-
157
-
158
-
159
-
160
-
161
-
162
-
163
-
164
-
165
-
166
-
167
-
168
-
169
-
170
-
171
-
172
-
173
-
174
-
175
-
176
-
177
-
178
-
179
-
180
-
181
-
182
-
183
-
184
-
185
-
186
-
187
-
188
-
189
-
190
-
191
-
192
-
193
-
194
-
195
-
196
-
197
-
198
-
199
-
200
-
201
-
202
-
203
-
204
-
205
-
206
-
207
-
208
-
209
-
210
-
211
-
212
-
213
-
214
-
215
-
216
-
217
-
218
-
219
-
220
-
221
-
222
-
223
-
224
-
225
-
226
-
227
-
228
-
229
-
230
-
231
-
232
-
233
-
234
-
235
-
236
-
237
-
238
-
239
-
240
-
241
-
242
-
243
-
244
-
245
-
246
-
247
-
248
-
249
-
250
-
251
-
252
-
253
-
254
-
255
-
256
-
257
-
258
-
259
-
260
-
261
-
262
-
263
-
264
-
265
-
266
-
267
-
268
-
269
-
270
-
271
-
272
-
273
-
274
-
275
 |
 |

PART II
Operating Expenses.
The increase was driven primarily by:
• A $315 million increase in fuel expense (including purchased
power and natural gas purchases for resale) primarily due to
higher volume of coal and gas used in electric generation
resulting from favorable weather conditions, and higher coal
prices, partially offset by lower natural gas prices to full-service
retail customers;
• A $162 million increase in operating and maintenance
expenses primarily due to costs related to the implementation
of the save-a-watt program, higher customer service
operations costs, higher benefit costs, higher nuclear, power
and gas delivery maintenance costs, higher outage costs at
fossil generation stations, and the disallowance in 2010 of a
portion of previously deferred costs in Ohio related to the 2008
Hurricane Ike wind storm, partially offset by overall lower
storm costs, including the establishment of a regulatory asset
to defer previously recognized costs related to an ice storm in
Indiana in early 2009;
• A $96 million increase in depreciation and amortization due
primarily to increases in depreciation as a result of additional
capital spending and amortization of regulatory assets; and
• A $44 million disallowance charge related to the Edwardsport
IGCC plant that is currently under construction. See Note 4 to
the Consolidated Financial Statements, “Regulatory Matters,”
for additional information.
Gains on Sales of Other Assets and Other, net.
The decrease is attributable primarily to lower net gains on sales
of emission allowances in 2010 compared to 2009.
Other Income and Expenses, net.
The increase resulted primarily from a higher equity component
of AFUDC from additional capital spending for increased construction
expenditures related to new generation and higher deferred returns.
EBIT.
As discussed above, the increase resulted primarily from overall
net higher retail pricing and rate riders, favorable weather, higher
equity component of AFUDC, higher wholesale power revenues, and
higher weather adjusted sales volumes. These positive impacts were
partially offset by higher operating and maintenance expenses,
increased depreciation and amortization, and the disallowance
charge related to the Edwardsport IGCC plant that is currently under
construction.
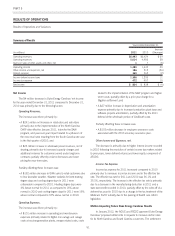
Commercial Power
Years Ended December 31,
(in millions, except where noted) 2011 2010
Variance
2011 vs.
2010 2009
Variance
2010 vs.
2009
Operating revenues $2,491 $ 2,448 $ 43 $ 2,114 $ 334
Operating expenses 2,275 2,710 (435) 2,134 576
Gains on sales of other assets and other, net 14 6812(6)
Operating income (loss) 230 (256) 486 (8) (248)
Other income and expenses, net 835 (27) 35 —
Expense attributable to noncontrolling interest 13 85—8
EBIT $225$ (229) $ 454 $ 27 $ (256)
Actual plant production, GWh 32,531 28,754 3,777 26,962 1,792
Net proportional megawatt capacity in operation 8,325 8,272 53 8,005 267
Year Ended December 31, 2011 as compared to December 31,
2010
Operating Revenues.
The increase was primarily driven by:
• A $240 million increase in wholesale electric revenues due to
higher generation volumes, net of lower pricing and lower
margin earned from participation in wholesale auctions in
2011; and
• A $53 million increase in renewable generation revenues due
to additional renewable generation facilities placed in service
after 2010 and a full year of operations for renewable
generation facilities placed in service throughout 2010.
Partially offsetting these increases were:
• A $178 million decrease in retail electric revenues resulting
from lower sales volumes driven by increased customer
switching levels and unfavorable weather net of higher retail
pricing under the ESP in 2011; and
• A $66 million decrease in DEGS revenues, excluding
renewables, due primarily to a contract termination and plant
maintenance.
46