Duke Energy 2011 Annual Report Download - page 16
Download and view the complete annual report
Please find page 16 of the 2011 Duke Energy annual report below. You can navigate through the pages in the report by either clicking on the pages listed below, or by using the keyword search tool below to find specific information within the annual report.-
 1
1 -
2
-
3
-
4
-
5
-
 6
6 -
 7
7 -
 8
8 -
 9
9 -
 10
10 -
 11
11 -
 12
12 -
 13
13 -
 14
14 -
 15
15 -
 16
16 -
 17
17 -
 18
18 -
 19
19 -
 20
20 -
 21
21 -
 22
22 -
 23
23 -
 24
24 -
 25
25 -
 26
26 -
27
-
28
-
29
-
30
-
31
-
32
-
33
-
34
-
35
-
36
-
37
-
38
-
39
-
40
-
41
-
42
-
43
-
44
-
45
-
46
-
47
-
48
-
49
-
50
-
51
-
52
-
53
-
54
-
55
-
56
-
57
-
58
-
59
-
60
-
61
-
62
-
63
-
64
-
65
-
66
-
67
-
68
-
69
-
70
-
71
-
72
-
73
-
74
-
75
-
76
-
77
-
78
-
79
-
80
-
81
-
82
-
83
-
84
-
85
-
86
-
87
-
88
-
89
-
90
-
91
-
92
-
93
-
94
-
95
-
96
-
97
-
98
-
99
-
100
-
101
-
102
-
103
-
104
-
105
-
106
-
107
-
108
-
109
-
110
-
111
-
112
-
113
-
114
-
115
-
116
-
117
-
118
-
119
-
120
-
121
-
122
-
123
-
124
-
125
-
126
-
127
-
128
-
129
-
130
-
131
-
132
-
133
-
134
-
135
-
136
-
137
-
138
-
139
-
140
-
141
-
142
-
143
-
144
-
145
-
146
-
147
-
148
-
149
-
150
-
151
-
152
-
153
-
154
-
155
-
156
-
157
-
158
-
159
-
160
-
161
-
162
-
163
-
164
-
165
-
166
-
167
-
168
-
169
-
170
-
171
-
172
-
173
-
174
-
175
-
176
-
177
-
178
-
179
-
180
-
181
-
182
-
183
-
184
-
185
-
186
-
187
-
188
-
189
-
190
-
191
-
192
-
193
-
194
-
195
-
196
-
197
-
198
-
199
-
200
-
201
-
202
-
203
-
204
-
205
-
206
-
207
-
208
-
209
-
210
-
211
-
212
-
213
-
214
-
215
-
216
-
217
-
218
-
219
-
220
-
221
-
222
-
223
-
224
-
225
-
226
-
227
-
228
-
229
-
230
-
231
-
232
-
233
-
234
-
235
-
236
-
237
-
238
-
239
-
240
-
241
-
242
-
243
-
244
-
245
-
246
-
247
-
248
-
249
-
250
-
251
-
252
-
253
-
254
-
255
-
256
-
257
-
258
-
259
-
260
-
261
-
262
-
263
-
264
-
265
-
266
-
267
-
268
-
269
-
270
-
271
-
272
-
273
-
274
-
275
 |
 |

NON-GAAP FINANCIAL MEASURES
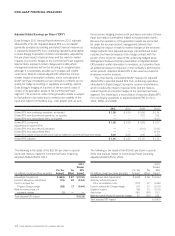
Adjusted Diluted Earnings per Share (“EPS”)
Duke Energy’s 2011 Annual Report references 2011 adjusted
diluted EPS of $1.46. Adjusted diluted EPS is a non-GAAP
(generally accepted accounting principles) financial measure as
it represents diluted EPS from continuing operations attributable
to Duke Energy Corporation common shareholders, adjusted for
the per share impact of special items and the mark-to-market
impacts of economic hedges in the Commercial Power segment.
Special items represent certain charges and credits which
management believes will not be recurring on a regular basis,
although it is reasonably possible such charges and credits
could recur. Mark-to-market adjustments reflect the mark-to-
market impact of derivative contracts, which is recognized in
GAAP earnings immediately as such derivative contracts do not
qualify for hedge accounting or regulatory accounting, used in
Duke Energy’s hedging of a portion of the economic value of
certain of its generation assets in the Commercial Power
segment. The economic value of the generation assets is subject
to fluctuations in fair value due to market price volatility of the
input and output commodities (e.g., coal, power) and, as such,
the economic hedging involves both purchases and sales of those
input and output commodities related to the generation assets.
Because the operations of the generation assets are accounted
for under the accrual method, management believes that
excluding the impact of mark-to-market changes of the economic
hedge contracts from adjusted earnings until settlement better
matches the financial impacts of the hedge contract with the
portion of the economic value of the underlying hedged asset.
Management believes that the presentation of adjusted diluted
EPS provides useful information to investors, as it provides them
an additional relevant comparison of the company’s performance
across periods. Adjusted diluted EPS is also used as a basis for
employee incentive bonuses.
The most directly comparable GAAP measure for adjusted
diluted EPS is reported diluted EPS from continuing operations
attributable to Duke Energy Corporation common shareholders,
which includes the impact of special items and the mark-to-
market impacts of economic hedges in the Commercial Power
segment. The following is a reconciliation of reported diluted EPS
from continuing operations to adjusted diluted EPS for 2011,
2010, 2009, and 2008:
2011 2010 2009 2008
Diluted EPS from continuing operations, as reported $ 1.28 $ 1.00 $ 0.82 $ 1.01
Diluted EPS from discontinued operations, as reported — — 0.01 0.01
Diluted EPS from extraordinary items, as reported — — — 0.05
Diluted EPS, as reported $ 1.28 $ 1.00 $ 0.83 $ 1.07
Adjustments to reported EPS:
Diluted EPS from discontinued operations — — (0.01) (0.01)
Diluted EPS from extraordinary items — — — (0.05)
Diluted EPS impact of special items and mark-to-market in Commercial Power (see below) 0.18 0.43 0.40 0.20
Diluted EPS, adjusted $ 1.46 $ 1.43 $ 1.22 $ 1.21
The following is the detail of the $(0.18) per share in special
items and mark-to-market in Commercial Power impacting
adjusted diluted EPS for 2011:
2011
Diluted
Pre-Tax Tax EPS
(In millions, except per-share amounts) Amount Effect Impact
Edwardsport impairment $ (222) $ 87 $ (0.10)
Emission allowances impairment (79) 28 (0.04)
Costs to achieve the
Progress Energy merger (68) 17 (0.04)
Mark-to-market impact of
economic hedges (1) — —
Total adjusted EPS impact $ (0.18)
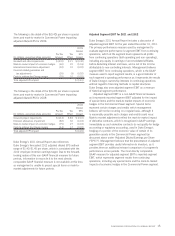
The following is the detail of the $(0.43) per share in special
items and mark-to-market in Commercial Power impacting
adjusted diluted EPS for 2010:
2010
Diluted
Pre-Tax Tax EPS
(In millions, except per-share amounts) Amount Effect Impact
Goodwill and other impairments $ (660) $ 58 $ (0.46)
Voluntary retirement plan &
office consolidation costs (172) 67 (0.08)
Costs to achieve the Cinergy merger (27) 10 (0.01)
Litigation reserve (26) 10 (0.01)
Asset sales 248 (94) 0.12
Mark-to-market impact of economic hedges 33 (12) 0.01
Total adjusted EPS impact $ (0.43)
14 DUKE ENERGY CORPORATION 2011 ANNUAL REPORT