Duke Energy 2011 Annual Report Download - page 54
Download and view the complete annual report
Please find page 54 of the 2011 Duke Energy annual report below. You can navigate through the pages in the report by either clicking on the pages listed below, or by using the keyword search tool below to find specific information within the annual report.-
 1
1 -
2
-
3
-
4
-
5
-
6
-
7
-
8
-
9
-
10
-
11
-
12
-
13
-
14
-
15
-
16
-
17
-
18
-
19
-
20
-
21
-
22
-
23
-
24
-
25
-
26
-
27
-
28
-
29
-
30
-
31
-
32
-
33
-
34
-
35
-
36
-
37
-
38
-
39
-
40
-
41
-
42
-
43
-
 44
44 -
 45
45 -
 46
46 -
 47
47 -
 48
48 -
 49
49 -
 50
50 -
 51
51 -
 52
52 -
 53
53 -
 54
54 -
 55
55 -
 56
56 -
 57
57 -
 58
58 -
 59
59 -
 60
60 -
 61
61 -
 62
62 -
 63
63 -
 64
64 -
65
-
66
-
67
-
68
-
69
-
70
-
71
-
72
-
73
-
74
-
75
-
76
-
77
-
78
-
79
-
80
-
81
-
82
-
83
-
84
-
85
-
86
-
87
-
88
-
89
-
90
-
91
-
92
-
93
-
94
-
95
-
96
-
97
-
98
-
99
-
100
-
101
-
102
-
103
-
104
-
105
-
106
-
107
-
108
-
109
-
110
-
111
-
112
-
113
-
114
-
115
-
116
-
117
-
118
-
119
-
120
-
121
-
122
-
123
-
124
-
125
-
126
-
127
-
128
-
129
-
130
-
131
-
132
-
133
-
134
-
135
-
136
-
137
-
138
-
139
-
140
-
141
-
142
-
143
-
144
-
145
-
146
-
147
-
148
-
149
-
150
-
151
-
152
-
153
-
154
-
155
-
156
-
157
-
158
-
159
-
160
-
161
-
162
-
163
-
164
-
165
-
166
-
167
-
168
-
169
-
170
-
171
-
172
-
173
-
174
-
175
-
176
-
177
-
178
-
179
-
180
-
181
-
182
-
183
-
184
-
185
-
186
-
187
-
188
-
189
-
190
-
191
-
192
-
193
-
194
-
195
-
196
-
197
-
198
-
199
-
200
-
201
-
202
-
203
-
204
-
205
-
206
-
207
-
208
-
209
-
210
-
211
-
212
-
213
-
214
-
215
-
216
-
217
-
218
-
219
-
220
-
221
-
222
-
223
-
224
-
225
-
226
-
227
-
228
-
229
-
230
-
231
-
232
-
233
-
234
-
235
-
236
-
237
-
238
-
239
-
240
-
241
-
242
-
243
-
244
-
245
-
246
-
247
-
248
-
249
-
250
-
251
-
252
-
253
-
254
-
255
-
256
-
257
-
258
-
259
-
260
-
261
-
262
-
263
-
264
-
265
-
266
-
267
-
268
-
269
-
270
-
271
-
272
-
273
-
274
-
275
 |
 |

PART II
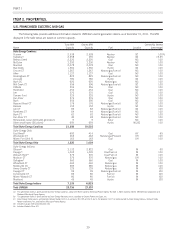
ITEM 6. SELECTED FINANCIAL DATA.(a)
(in millions, except per-share amounts) 2011 2010 2009 2008 2007
Statement of Operations
Total operating revenues $14,529 $14,272 $12,731 $13,207 $12,720
Total operating expenses 11,760 11,964 10,518 10,765 10,222
Gains (losses) on sales of other assets and other, net 81533669 (5)
Operating income 2,777 2,461 2,249 2,511 2,493
Total other income and expenses 547 589 333 121 428
Interest expense 859 840 751 741 685
Income from continuing operations before income taxes 2,465 2,210 1,831 1,891 2,236
Income tax expense from continuing operations 752 890 758 616 712
Income from continuing operations 1,713 1,320 1,073 1,275 1,524
Income (loss) from discontinued operations, net of tax 131216(22)
Income before Extraordinary Items 1,714 1,323 1,085 1,291 1,502
Extraordinary items, net of tax ———67—
Net income 1,714 1,323 1,085 1,358 1,502
Net income (loss) attributable to noncontrolling interests 8310 (4) 2
Net income attributable to Duke Energy Corporation $ 1,706 $1,320 $1,075 $1,362 $1,500
Ratio of Earnings to Fixed Charges 3.2 3.0 3.0 3.4 3.7
Common Stock Data
Shares of common stock outstanding
Year-end 1,336 1,329 1,309 1,272 1,262
Weighted average — basic 1,332 1,318 1,293 1,265 1,260
Weighted average — diluted 1,333 1,319 1,294 1,267 1,265
Income from continuing operations attributable to Duke Energy Corporation common
shareholders
Basic $1.28 $ 1.00 $ 0.82 $ 1.01 $ 1.21
Diluted 1.28 1.00 0.82 1.01 1.20
Income (loss) from discontinued operations attributable to Duke Energy Corporation
common shareholders
Basic $—$ — $ 0.01 $ 0.02 $ (0.02)
Diluted —— 0.01 0.01 (0.02)
Earnings per share (before extraordinary items)
Basic $1.28 $ 1.00 $ 0.83 $ 1.03 $ 1.19
Diluted 1.28 1.00 0.83 1.02 1.18
Earnings per share (from extraordinary items)
Basic $—$—$—$0.05$—
Diluted —— — 0.05 —
Net income attributable to Duke Energy Corporation common shareholders
Basic $1.28 $ 1.00 $ 0.83 $ 1.08 $ 1.19
Diluted 1.28 1.00 0.83 1.07 1.18
Dividends declared per share 0.99 0.97 0.94 0.90 0.86
Balance Sheet
Total assets $62,526 $59,090 $57,040 $53,077 $49,686
Long-term debt including capital leases and VIEs, less current maturities $18,679 $17,935 $16,113 $13,250 $ 9,498
(a) Significant transactions reflected in the results above include: 2011, 2010 and 2009 impairments of goodwill and other assets (see Note 12 to the Consolidated Financial Statements,
“Goodwill, Intangible Assets and Impairments”).
34