Duke Energy 2011 Annual Report Download - page 195
Download and view the complete annual report
Please find page 195 of the 2011 Duke Energy annual report below. You can navigate through the pages in the report by either clicking on the pages listed below, or by using the keyword search tool below to find specific information within the annual report.-
 1
1 -
2
-
3
-
4
-
5
-
6
-
7
-
8
-
9
-
10
-
11
-
12
-
13
-
14
-
15
-
16
-
17
-
18
-
19
-
20
-
21
-
22
-
23
-
24
-
25
-
26
-
27
-
28
-
29
-
30
-
31
-
32
-
33
-
34
-
35
-
36
-
37
-
38
-
39
-
40
-
41
-
42
-
43
-
44
-
45
-
46
-
47
-
48
-
49
-
50
-
51
-
52
-
53
-
54
-
55
-
56
-
57
-
58
-
59
-
60
-
61
-
62
-
63
-
64
-
65
-
66
-
67
-
68
-
69
-
70
-
71
-
72
-
73
-
74
-
75
-
76
-
77
-
78
-
79
-
80
-
81
-
82
-
83
-
84
-
85
-
86
-
87
-
88
-
89
-
90
-
91
-
92
-
93
-
94
-
95
-
96
-
97
-
98
-
99
-
100
-
101
-
102
-
103
-
104
-
105
-
106
-
107
-
108
-
109
-
110
-
111
-
112
-
113
-
114
-
115
-
116
-
117
-
118
-
119
-
120
-
121
-
122
-
123
-
124
-
125
-
126
-
127
-
128
-
129
-
130
-
131
-
132
-
133
-
134
-
135
-
136
-
137
-
138
-
139
-
140
-
141
-
142
-
143
-
144
-
145
-
146
-
147
-
148
-
149
-
150
-
151
-
152
-
153
-
154
-
155
-
156
-
157
-
158
-
159
-
160
-
161
-
162
-
163
-
164
-
165
-
166
-
167
-
168
-
169
-
170
-
171
-
172
-
173
-
174
-
175
-
176
-
177
-
178
-
179
-
180
-
181
-
182
-
183
-
184
-
 185
185 -
 186
186 -
 187
187 -
 188
188 -
 189
189 -
 190
190 -
 191
191 -
 192
192 -
 193
193 -
 194
194 -
 195
195 -
 196
196 -
 197
197 -
 198
198 -
 199
199 -
 200
200 -
 201
201 -
 202
202 -
 203
203 -
 204
204 -
 205
205 -
206
-
207
-
208
-
209
-
210
-
211
-
212
-
213
-
214
-
215
-
216
-
217
-
218
-
219
-
220
-
221
-
222
-
223
-
224
-
225
-
226
-
227
-
228
-
229
-
230
-
231
-
232
-
233
-
234
-
235
-
236
-
237
-
238
-
239
-
240
-
241
-
242
-
243
-
244
-
245
-
246
-
247
-
248
-
249
-
250
-
251
-
252
-
253
-
254
-
255
-
256
-
257
-
258
-
259
-
260
-
261
-
262
-
263
-
264
-
265
-
266
-
267
-
268
-
269
-
270
-
271
-
272
-
273
-
274
-
275
 |
 |

PART II
DUKE ENERGY CORPORATION •DUKE ENERGY CAROLINAS, LLC •DUKE ENERGY OHIO, INC. •DUKE ENERGY INDIANA, INC.
Combined Notes to Consolidated Financial Statements – (Continued)
the security to make scheduled interest or principal payments and
any changes to the rating of the security by rating agencies. If it is
determined that a credit loss exists, the amount of impairment write-
down to fair value would be split between the credit loss, which
would be recognized in earnings, and the amount attributable to all
other factors, which would be recognized in other comprehensive
income. Since management believes, based on consideration of the
criteria above, that no credit loss exists as of December 31, 2011
and 2010, and management does not have the intent to sell such
investments in auction rate debt securities and the investments in
debt securities within its captive insurance investment portfolio, and
foreign operations investment portfolio, and it is not more likely than
not that management will be required to sell these securities before
the anticipated recovery of their cost basis, management concluded
that there were no other-than-temporary impairments necessary as of
December 31, 2011 and 2010. Accordingly, all changes in the
market value of investments in auction rate debt securities, captive
insurance investments, and foreign operation investments were
reflected as a component of other comprehensive income in 2011
and 2010. See Note 15 for additional information related to fair value
measurements for investments in auction rate debt securities.
Management will continue to monitor the carrying value of its
entire portfolio of investments in the future to determine if any
additional other-than-temporary impairment losses should be
recorded.
Investments in debt and equity securities are classified as either
short-term investments or long-term investments based on
management’s intent and ability to sell these securities, taking into
consideration liquidity factors in the current markets with respect to
certain short-term investments that have historically provided for a
high degree of liquidity, such as investments in auction rate debt
securities.
Short-term investments.
During the year ended December 31, 2011, Duke Energy
purchased $190 million of corporate debt securities using excess
cash from its foreign operations. These investments are classified as
Short-Term Investments on the balance sheet and are available for
current operations of Duke Energy’s foreign business. During the year
ended December 31, 2011, Duke Energy received proceeds on sales
of auction rate securities of approximately $59 million (par value).
During the year ended December 31 2010, there were no purchases
or sales of short-term investments.
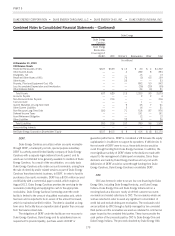
Long-term investments.
Duke Energy classifies its investments in debt and equity
securities held in the Duke Energy Carolinas NDTF (see Note 15 for
further information), the Duke Energy Indiana grantor trust and the
captive insurance investment portfolio as long term. Additionally,
Duke Energy has classified $71 million carrying value ($89 million
par value) and $118 million carrying value ($149 million par value)
of investments in auction rate debt securities as long-term at
December 31, 2011 and 2010, respectively, due to market illiquidity
factors as a result of continued failed auctions. All of these
investments are classified as available-for-sale and, therefore, are
reflected on the Consolidated Balance Sheets at estimated fair value
based on either quoted market prices or management’s best estimate
of fair value based on expected future cash flow using appropriate
risk-adjusted discount rates. Since management does not intend to
use these investments in current operations, these investments are
classified as long term.
The cost of securities is determined using the specific
identification method.
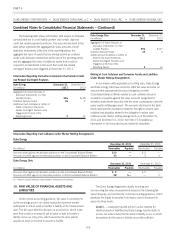
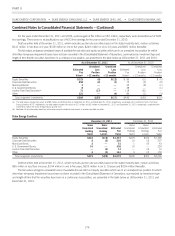
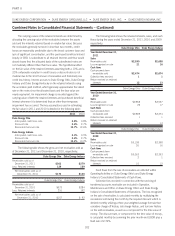
The estimated fair values of investments classified as
available-for-sale are as follows (in millions):
Duke Energy
December 31, 2011 December 31, 2010
Gross
Unrealized
Holding
Gains(a)
Gross
Unrealized
Holding
Losses(a)
Estimated
Fair
Value
Gross
Unrealized
Holding
Gains(a)
Gross
Unrealized
Holding
Losses(a)
Estimated
Fair
Value
Short-term Investments $— $— $190 $— $— $ —
Total short-term investments $— $— $190 $— $— $ —
Equity Securities $448 $(18) $1,397 $481 $(16) $1,435
Corporate Debt Securities 9(3)25612 (3) 270
Municipal Bonds 3—79 1 (9) 69
U.S. Government Bonds 17 — 327 10 (1) 235
Auction Rate Debt Securities —(17)71 — (31) 118
Other 6(4)22911 (5) 274
Total long-term investments $483 $(42) $2,359 $515 $(65) $2,401
(a) The table above includes unrealized gains and losses of $473 million and $22 million, respectively, at December 31, 2011 and unrealized gains and losses of $505 million and $32
million, respectively, at December 31, 2010 associated with investments held in the Duke Energy Carolinas NDTF. Additionally, the table above includes unrealized gains of $6 million
and $1 million of unrealized losses at December 31, 2011, and unrealized gains of $6 million and an insignificant amount of unrealized losses, at December 31, 2010 associated with
investments held in the Duke Energy Indiana grantor trust. As discussed above, unrealized losses on investments within the NDTF and Duke Energy Indiana grantor trust are deferred as
a regulatory asset pursuant to regulatory accounting treatment.
175