Duke Energy 2011 Annual Report Download - page 208
Download and view the complete annual report
Please find page 208 of the 2011 Duke Energy annual report below. You can navigate through the pages in the report by either clicking on the pages listed below, or by using the keyword search tool below to find specific information within the annual report.-
 1
1 -
2
-
3
-
4
-
5
-
6
-
7
-
8
-
9
-
10
-
11
-
12
-
13
-
14
-
15
-
16
-
17
-
18
-
19
-
20
-
21
-
22
-
23
-
24
-
25
-
26
-
27
-
28
-
29
-
30
-
31
-
32
-
33
-
34
-
35
-
36
-
37
-
38
-
39
-
40
-
41
-
42
-
43
-
44
-
45
-
46
-
47
-
48
-
49
-
50
-
51
-
52
-
53
-
54
-
55
-
56
-
57
-
58
-
59
-
60
-
61
-
62
-
63
-
64
-
65
-
66
-
67
-
68
-
69
-
70
-
71
-
72
-
73
-
74
-
75
-
76
-
77
-
78
-
79
-
80
-
81
-
82
-
83
-
84
-
85
-
86
-
87
-
88
-
89
-
90
-
91
-
92
-
93
-
94
-
95
-
96
-
97
-
98
-
99
-
100
-
101
-
102
-
103
-
104
-
105
-
106
-
107
-
108
-
109
-
110
-
111
-
112
-
113
-
114
-
115
-
116
-
117
-
118
-
119
-
120
-
121
-
122
-
123
-
124
-
125
-
126
-
127
-
128
-
129
-
130
-
131
-
132
-
133
-
134
-
135
-
136
-
137
-
138
-
139
-
140
-
141
-
142
-
143
-
144
-
145
-
146
-
147
-
148
-
149
-
150
-
151
-
152
-
153
-
154
-
155
-
156
-
157
-
158
-
159
-
160
-
161
-
162
-
163
-
164
-
165
-
166
-
167
-
168
-
169
-
170
-
171
-
172
-
173
-
174
-
175
-
176
-
177
-
178
-
179
-
180
-
181
-
182
-
183
-
184
-
185
-
186
-
187
-
188
-
189
-
190
-
191
-
192
-
193
-
194
-
195
-
196
-
197
-
 198
198 -
 199
199 -
 200
200 -
 201
201 -
 202
202 -
 203
203 -
 204
204 -
 205
205 -
 206
206 -
 207
207 -
 208
208 -
 209
209 -
 210
210 -
 211
211 -
 212
212 -
 213
213 -
 214
214 -
 215
215 -
 216
216 -
 217
217 -
 218
218 -
219
-
220
-
221
-
222
-
223
-
224
-
225
-
226
-
227
-
228
-
229
-
230
-
231
-
232
-
233
-
234
-
235
-
236
-
237
-
238
-
239
-
240
-
241
-
242
-
243
-
244
-
245
-
246
-
247
-
248
-
249
-
250
-
251
-
252
-
253
-
254
-
255
-
256
-
257
-
258
-
259
-
260
-
261
-
262
-
263
-
264
-
265
-
266
-
267
-
268
-
269
-
270
-
271
-
272
-
273
-
274
-
275
 |
 |

PART II
DUKE ENERGY CORPORATION •DUKE ENERGY CAROLINAS, LLC •DUKE ENERGY OHIO, INC. •DUKE ENERGY INDIANA, INC.
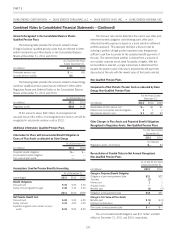
Combined Notes to Consolidated Financial Statements – (Continued)
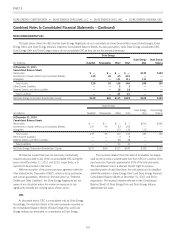
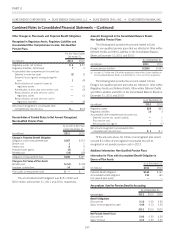
Duke Energy’s policy is to fund amounts on an actuarial basis to
provide assets sufficient to meet benefit payments to be paid to plan
participants. The following table includes information related to Duke
Energy’s contributions to its U.S. qualified defined benefit pension
plans.
For the Years Ended
December 31,
(in millions) 2012 2011 2010 2009
Contributions made — $200 $400 $800
Anticipated contributions $200 ———
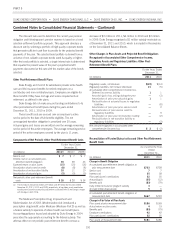
Actuarial gains and losses subject to amortization are amortized
over the average remaining service period of the active employees.
The average remaining service period of active employees covered by
the qualified retirement plans is ten years. The average remaining
service period of active employees covered by the non-qualified
retirement plans is nine years. Duke Energy determines the market-
related value of plan assets using a calculated value that recognizes
changes in fair value of the plan assets in a particular year on a
straight line basis over the next five years.
Net periodic benefit costs disclosed in the tables below for the
qualified, non-qualified and other post-retirement benefit plans
represent the cost of the respective benefit plan for the periods
presented. However, portions of the net periodic benefit costs
disclosed in the tables below have been capitalized as a component
of property, plant and equipment.
Duke Energy uses a December 31 measurement date for its
defined benefit retirement plan assets and obligations.
Qualified Pension Plans
Components of Net Periodic Pension Costs: Qualified Pension
Plans
For the Years Ended
December 31,
(in millions) 2011(a) 2010(a) 2009(a)
Service cost $96 $96 $85
Interest cost on projected benefit
obligation 232 248 257
Expected return on plan assets (384) (378) (362)
Amortization of prior service cost 657
Amortization of actuarial loss 77 50 2
Settlement and contractual termination
benefit cost —13 —
Other 18 18 17
Net periodic pension costs $45 $52 $ 6
(a) These amounts exclude $14 million, $16 million and $10 million for the years ended
December 31, 2011, 2010 and 2009, respectively, of regulatory asset amortization
resulting from purchase accounting adjustments associated with Duke Energy’s merger
with Cinergy in April 2006.
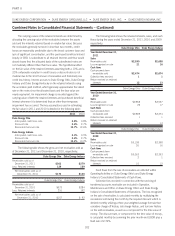
Other Changes in Plan Assets and Projected Benefit Obligations
Recognized in Accumulated Other Comprehensive Income and
Regulatory Assets: Qualified Pension Plans
For the Years Ended
December 31,
(in millions) 2011 2010
Regulatory assets, net increase $152 $ 350
Accumulated other comprehensive (income) loss(a)
Deferred income tax asset (10) 143
Actuarial losses (gains) arising during the
year 60 (5)
Amortization of prior year actuarial losses (8) (16)
Reclassification of actuarial gains (losses) to
regulatory assets 8(365)
Amortization of prior year prior service cost (1) (3)
Reclassification of prior service cost to
regulatory assets —(19)
Net amount recognized in accumulated other
comprehensive (income) loss $49 $(265)
(a) Excludes actuarial losses of $2 million in 2011 and $3 million in 2010 recognized in
other accumulated comprehensive income, net of tax, associated with a Brazilian
retirement plan.
Reconciliation of Funded Status to Net Amount Recognized:
Qualified Pension Plans
As of and for the Years
Ended December 31,
(in millions) 2011 2010
Change in Projected Benefit Obligation
Obligation at prior measurement date $4,861 $4,695
Service cost 96 96
Interest cost 232 248
Actuarial (gains) losses (7) 190
Plan amendments 18 2
Settlement and contractual termination
benefit cost —13
Benefits paid (320) (383)
Obligation at measurement date $4,880 $4,861
The accumulated benefit obligation was $4,661 million and
$4,611 million at December 31, 2011 and 2010, respectively.
As of and for the Years
Ended December 31,
(in millions) 2011 2010
Change in Fair Value of Plan Assets
Plan assets at prior measurement date $4,797 $4,224
Actual return on plan assets 64 556
Benefits paid (320) (383)
Employer contributions 200 400
Plan assets at measurement date $4,741 $4,797
188