Duke Energy 2011 Annual Report Download - page 69
Download and view the complete annual report
Please find page 69 of the 2011 Duke Energy annual report below. You can navigate through the pages in the report by either clicking on the pages listed below, or by using the keyword search tool below to find specific information within the annual report.-
 1
1 -
 2
2 -
 3
3 -
 4
4 -
 5
5 -
 6
6 -
 7
7 -
 8
8 -
 9
9 -
 10
10 -
 11
11 -
 12
12 -
 13
13 -
 14
14 -
 15
15 -
 16
16 -
 17
17 -
 18
18 -
 19
19 -
 20
20 -
 21
21 -
 22
22 -
 23
23 -
 24
24 -
 25
25 -
 26
26 -
 27
27 -
 28
28 -
 29
29 -
 30
30 -
 31
31 -
 32
32 -
 33
33 -
 34
34 -
 35
35 -
 36
36 -
 37
37 -
 38
38 -
 39
39 -
 40
40 -
 41
41 -
 42
42 -
 43
43 -
 44
44 -
 45
45 -
 46
46 -
 47
47 -
 48
48 -
 49
49 -
 50
50 -
 51
51 -
 52
52 -
 53
53 -
 54
54 -
 55
55 -
 56
56 -
 57
57 -
 58
58 -
 59
59 -
 60
60 -
 61
61 -
 62
62 -
 63
63 -
 64
64 -
 65
65 -
 66
66 -
 67
67 -
 68
68 -
 69
69 -
 70
70 -
 71
71 -
 72
72 -
 73
73 -
 74
74 -
 75
75 -
 76
76 -
 77
77 -
 78
78 -
 79
79 -
 80
80 -
 81
81 -
 82
82 -
 83
83 -
 84
84 -
 85
85 -
 86
86 -
 87
87 -
 88
88 -
 89
89 -
 90
90 -
 91
91 -
 92
92 -
 93
93 -
 94
94 -
 95
95 -
 96
96 -
 97
97 -
 98
98 -
 99
99 -
 100
100 -
 101
101 -
 102
102 -
 103
103 -
 104
104 -
 105
105 -
 106
106 -
 107
107 -
 108
108 -
 109
109 -
 110
110 -
 111
111 -
 112
112 -
 113
113 -
 114
114 -
 115
115 -
 116
116 -
 117
117 -
 118
118 -
 119
119 -
 120
120 -
 121
121 -
 122
122 -
 123
123 -
 124
124 -
 125
125 -
 126
126 -
 127
127 -
 128
128 -
 129
129 -
 130
130 -
 131
131 -
 132
132 -
 133
133 -
 134
134 -
 135
135 -
 136
136 -
 137
137 -
 138
138 -
 139
139 -
 140
140 -
 141
141 -
 142
142 -
 143
143 -
 144
144 -
 145
145 -
 146
146 -
 147
147 -
 148
148 -
 149
149 -
 150
150 -
 151
151 -
 152
152 -
 153
153 -
 154
154 -
 155
155 -
 156
156 -
 157
157 -
 158
158 -
 159
159 -
 160
160 -
 161
161 -
 162
162 -
 163
163 -
 164
164 -
 165
165 -
 166
166 -
 167
167 -
 168
168 -
 169
169 -
 170
170 -
 171
171 -
 172
172 -
 173
173 -
 174
174 -
 175
175 -
 176
176 -
 177
177 -
 178
178 -
 179
179 -
 180
180 -
 181
181 -
 182
182 -
 183
183 -
 184
184 -
 185
185 -
 186
186 -
 187
187 -
 188
188 -
 189
189 -
 190
190 -
 191
191 -
 192
192 -
 193
193 -
 194
194 -
 195
195 -
 196
196 -
 197
197 -
 198
198 -
 199
199 -
 200
200 -
 201
201 -
 202
202 -
 203
203 -
 204
204 -
 205
205 -
 206
206 -
 207
207 -
 208
208 -
 209
209 -
 210
210 -
 211
211 -
 212
212 -
 213
213 -
 214
214 -
 215
215 -
 216
216 -
 217
217 -
 218
218 -
 219
219 -
 220
220 -
 221
221 -
 222
222 -
 223
223 -
 224
224 -
 225
225 -
 226
226 -
 227
227 -
 228
228 -
 229
229 -
 230
230 -
 231
231 -
 232
232 -
 233
233 -
 234
234 -
 235
235 -
 236
236 -
 237
237 -
 238
238 -
 239
239 -
 240
240 -
 241
241 -
 242
242 -
 243
243 -
 244
244 -
 245
245 -
 246
246 -
 247
247 -
 248
248 -
 249
249 -
 250
250 -
 251
251 -
 252
252 -
 253
253 -
 254
254 -
 255
255 -
 256
256 -
 257
257 -
 258
258 -
 259
259 -
 260
260 -
 261
261 -
 262
262 -
 263
263 -
 264
264 -
 265
265 -
 266
266 -
 267
267 -
 268
268 -
 269
269 -
 270
270 -
 271
271 -
 272
272 -
 273
273 -
 274
274 -
 275
275
 |
 |

PART II
Operating Expenses.
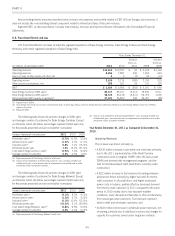
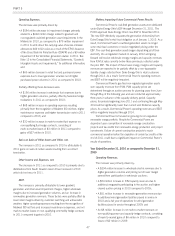
The increase was driven primarily by:
• A $77 million increase in Central America due to higher fuel
costs and consumption as a result of increased dispatch;
• A $56 million increase in Peru as a result of higher fuel costs
and consumption as a result of increased dispatch, purchased
power and hydrocarbon royalty costs; and
• A $25 million increase in Brazil as a result of unfavorable
exchange rates, higher purchased power and a provision for a
revenue tax audit.
Partially offsetting these increases was:
• A $27 million decrease in Ecuador due to lower fuel
consumption as a result of lower dispatch, and lower
maintenance costs.
Other Income and Expenses, net.
The increase was primarily driven by a $44 million increase in
equity earnings from NMC due to higher average prices partially offset
by higher butane costs, and a $20 million arbitration award in Peru.
EBIT.
As discussed above, the increase was primarily due to favorable
contract prices and exchange rates in Brazil, arbitration award and
higher margins in Peru, favorable hydrology in Central America, and
higher equity earnings at NMC.
Year Ended December 31, 2010 as Compared to December 31,
2009
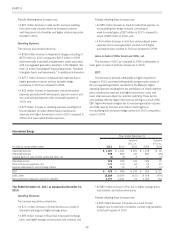
Operating Revenues.
The increase was driven primarily by:
• A $105 million increase in Brazil due to favorable exchange
rates, higher average contract prices, and favorable hydrology.
Partially offsetting this increase was:
• A $54 million decrease in Central America due to lower
dispatch as a result of unfavorable hydrology, partially offset by
higher average prices.
Operating Expenses.
The decrease was driven primarily by:
• A $27 million decrease in Central America due to lower fuel
consumption as a result of lower dispatch; and
• A $13 million decrease in general and administrative due to
lower legal, development, and labor costs.
Partially offsetting these decreases was:
• A $9 million increase in Peru due to higher hydrocarbon
royalty costs.
Other Income and Expenses, net.
The increase was driven by a $24 million increase due to the
absence of 2009 losses from its investment in Attiki and a $23
million increase in equity earnings from NMC due to higher average
prices and methyl tertiary butyl ether (MTBE) volumes, partially offset
by higher butane costs.
EBIT.
The increase in EBIT was primarily due to favorable results in
Brazil, the absence of a provision recorded in 2009 related to
transmission fees in Brazil, 2009 equity losses associated with Attiki,
higher equity earnings from NMC, and lower general and administrative
costs, partially offset by lower results in Central America.
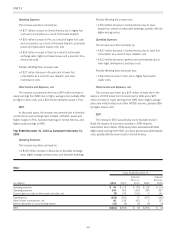
Other
Years Ended December 31,
(in millions) 2011 2010
Variance
2011 vs.
2010 2009
Variance
2010 vs.
2009
Operating revenues $44 $ 118 $ (74) $ 128 $ (10)
Operating expenses 354 656 (302) 389 267
(Losses) gains on sales of other assets and other, net (8) 145 (153) 4 141
Operating loss (318) (393) 75 (257) (136)
Other income and expenses, net 42 129 (87) 2 127
Benefit attributable to noncontrolling interest (15) (9) (6) (4) (5)
EBIT $(261) $(255) $ (6) $(251) $ (4)
49
