Duke Energy 2011 Annual Report Download - page 207
Download and view the complete annual report
Please find page 207 of the 2011 Duke Energy annual report below. You can navigate through the pages in the report by either clicking on the pages listed below, or by using the keyword search tool below to find specific information within the annual report.-
 1
1 -
2
-
3
-
4
-
5
-
6
-
7
-
8
-
9
-
10
-
11
-
12
-
13
-
14
-
15
-
16
-
17
-
18
-
19
-
20
-
21
-
22
-
23
-
24
-
25
-
26
-
27
-
28
-
29
-
30
-
31
-
32
-
33
-
34
-
35
-
36
-
37
-
38
-
39
-
40
-
41
-
42
-
43
-
44
-
45
-
46
-
47
-
48
-
49
-
50
-
51
-
52
-
53
-
54
-
55
-
56
-
57
-
58
-
59
-
60
-
61
-
62
-
63
-
64
-
65
-
66
-
67
-
68
-
69
-
70
-
71
-
72
-
73
-
74
-
75
-
76
-
77
-
78
-
79
-
80
-
81
-
82
-
83
-
84
-
85
-
86
-
87
-
88
-
89
-
90
-
91
-
92
-
93
-
94
-
95
-
96
-
97
-
98
-
99
-
100
-
101
-
102
-
103
-
104
-
105
-
106
-
107
-
108
-
109
-
110
-
111
-
112
-
113
-
114
-
115
-
116
-
117
-
118
-
119
-
120
-
121
-
122
-
123
-
124
-
125
-
126
-
127
-
128
-
129
-
130
-
131
-
132
-
133
-
134
-
135
-
136
-
137
-
138
-
139
-
140
-
141
-
142
-
143
-
144
-
145
-
146
-
147
-
148
-
149
-
150
-
151
-
152
-
153
-
154
-
155
-
156
-
157
-
158
-
159
-
160
-
161
-
162
-
163
-
164
-
165
-
166
-
167
-
168
-
169
-
170
-
171
-
172
-
173
-
174
-
175
-
176
-
177
-
178
-
179
-
180
-
181
-
182
-
183
-
184
-
185
-
186
-
187
-
188
-
189
-
190
-
191
-
192
-
193
-
194
-
195
-
196
-
 197
197 -
 198
198 -
 199
199 -
 200
200 -
 201
201 -
 202
202 -
 203
203 -
 204
204 -
 205
205 -
 206
206 -
 207
207 -
 208
208 -
 209
209 -
 210
210 -
 211
211 -
 212
212 -
 213
213 -
 214
214 -
 215
215 -
 216
216 -
 217
217 -
218
-
219
-
220
-
221
-
222
-
223
-
224
-
225
-
226
-
227
-
228
-
229
-
230
-
231
-
232
-
233
-
234
-
235
-
236
-
237
-
238
-
239
-
240
-
241
-
242
-
243
-
244
-
245
-
246
-
247
-
248
-
249
-
250
-
251
-
252
-
253
-
254
-
255
-
256
-
257
-
258
-
259
-
260
-
261
-
262
-
263
-
264
-
265
-
266
-
267
-
268
-
269
-
270
-
271
-
272
-
273
-
274
-
275
 |
 |

PART II
DUKE ENERGY CORPORATION •DUKE ENERGY CAROLINAS, LLC •DUKE ENERGY OHIO, INC. •DUKE ENERGY INDIANA, INC.
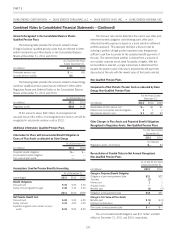
Combined Notes to Consolidated Financial Statements – (Continued)
Duke Energy, to simulate Duke Energy’s relative TSR as of the end of
the performance period. For each simulation, Duke Energy’s relative
TSR associated with the simulated stock price at the end of the
performance period plus expected dividends within the period results
in a value per share for the award portfolio. The average of these
simulations is the expected portfolio value per share. Actual life to
date results of Duke Energy’s relative TSR for each grant is
incorporated within the model. Other performance awards not
containing market conditions were awarded in 2011, 2010 and
2009. The performance goal for the 2011 and 2010 award is Duke
Energy’s Return on Equity (ROE) over a three year period. The
performance goal for the 2009 award is Duke Energy’s compounded
annual growth rate of annual diluted EPS, adjusted for certain items,
over a three year period. All of these awards are measured at grant
date price. The following table includes information related to Duke
Energy’s performance awards.
Shares awarded
(in thousands)
Fair value(a)
(in millions)
Years ended December 31,
2011 1,294 $20
2010 2,734 38
2009 3,426 44
(a) Based on the market price of Duke Energy’s common stock at the grant date.
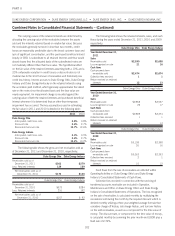
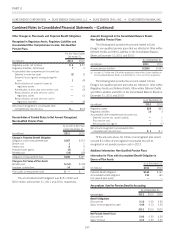
The following table summarizes information about stock-based
performance awards outstanding at the maximum level at
December 31, 2011:
Shares
(in thousands)
Weighted Average
Per Share
Grant
Date Fair Value
Number of Stock-based
Performance Awards:
Outstanding at December 31,
2010 7,550 $14
Granted 1,294 16
Vested (2,111) 16
Forfeited (363) 13
Outstanding at December 31,
2011 6,370 $14
Stock-based Performance Awards
Expected to Vest 6,212 $14
The total grant date fair value of the shares vested during the
years ended December 31, 2011, 2010 and 2009 was $33
million, $15 million and $20 million, respectively. At December 31,
2011, Duke Energy had $17 million of unrecognized compensation
cost which is expected to be recognized over a weighted-average
period of 1.5 years.
Other Stock Awards
Other stock awards issued and outstanding under the 1998
Plan vest over periods from three to five years. There were no other
stock awards issued during the years ended December 31, 2011,
2010 or 2009.
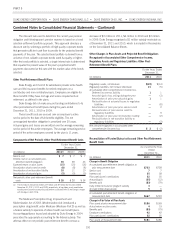
The following table summarizes information about other stock
awards outstanding at December 31, 2011:
Shares
(in thousands)
Weighted Average Per Share
Grant
Date Fair Value
Number of Other Stock
Awards:
Outstanding at
December 31,
2010 131 $28
Vested (131) 28
Forfeited — —
Outstanding at
December 31, 2011 —$—
The total fair value of the shares vested during the years ended
December 31, 2011, 2010 and 2009 was $4 million, $1 million,
and $1 million, respectively.
21. EMPLOYEE BENEFIT PLANS
Duke Energy
Defined Benefit Retirement Plans
Duke Energy and its subsidiaries (including legacy Cinergy
businesses) maintain qualified, non-contributory defined benefit
retirement plans. The plans cover most U.S. employees using a cash
balance formula. Under a cash balance formula, a plan participant
accumulates a retirement benefit consisting of pay credits that are
based upon a percentage (which varies with age and years of service)
of current eligible earnings and current interest credits. Certain legacy
Cinergy U.S. employees are covered under plans that use a final
average earnings formula. Under a final average earnings formula, a
plan participant accumulates a retirement benefit equal to a
percentage of their highest 3-year average earnings, plus a
percentage of their highest 3-year average earnings in excess of
covered compensation per year of participation (maximum of 35
years), plus a percentage of their highest 3-year average earnings
times years of participation in excess of 35 years. Duke Energy also
maintains non-qualified, non-contributory defined benefit retirement
plans which cover certain executives.
187