Duke Energy 2011 Annual Report Download - page 65
Download and view the complete annual report
Please find page 65 of the 2011 Duke Energy annual report below. You can navigate through the pages in the report by either clicking on the pages listed below, or by using the keyword search tool below to find specific information within the annual report.-
 1
1 -
2
-
3
-
4
-
5
-
6
-
7
-
8
-
9
-
10
-
11
-
12
-
13
-
14
-
15
-
16
-
17
-
18
-
19
-
20
-
21
-
22
-
23
-
24
-
25
-
26
-
27
-
28
-
29
-
30
-
31
-
32
-
33
-
34
-
35
-
36
-
37
-
38
-
39
-
40
-
41
-
42
-
43
-
44
-
45
-
46
-
47
-
48
-
49
-
50
-
51
-
52
-
53
-
54
-
 55
55 -
 56
56 -
 57
57 -
 58
58 -
 59
59 -
 60
60 -
 61
61 -
 62
62 -
 63
63 -
 64
64 -
 65
65 -
 66
66 -
 67
67 -
 68
68 -
 69
69 -
 70
70 -
 71
71 -
 72
72 -
 73
73 -
 74
74 -
 75
75 -
76
-
77
-
78
-
79
-
80
-
81
-
82
-
83
-
84
-
85
-
86
-
87
-
88
-
89
-
90
-
91
-
92
-
93
-
94
-
95
-
96
-
97
-
98
-
99
-
100
-
101
-
102
-
103
-
104
-
105
-
106
-
107
-
108
-
109
-
110
-
111
-
112
-
113
-
114
-
115
-
116
-
117
-
118
-
119
-
120
-
121
-
122
-
123
-
124
-
125
-
126
-
127
-
128
-
129
-
130
-
131
-
132
-
133
-
134
-
135
-
136
-
137
-
138
-
139
-
140
-
141
-
142
-
143
-
144
-
145
-
146
-
147
-
148
-
149
-
150
-
151
-
152
-
153
-
154
-
155
-
156
-
157
-
158
-
159
-
160
-
161
-
162
-
163
-
164
-
165
-
166
-
167
-
168
-
169
-
170
-
171
-
172
-
173
-
174
-
175
-
176
-
177
-
178
-
179
-
180
-
181
-
182
-
183
-
184
-
185
-
186
-
187
-
188
-
189
-
190
-
191
-
192
-
193
-
194
-
195
-
196
-
197
-
198
-
199
-
200
-
201
-
202
-
203
-
204
-
205
-
206
-
207
-
208
-
209
-
210
-
211
-
212
-
213
-
214
-
215
-
216
-
217
-
218
-
219
-
220
-
221
-
222
-
223
-
224
-
225
-
226
-
227
-
228
-
229
-
230
-
231
-
232
-
233
-
234
-
235
-
236
-
237
-
238
-
239
-
240
-
241
-
242
-
243
-
244
-
245
-
246
-
247
-
248
-
249
-
250
-
251
-
252
-
253
-
254
-
255
-
256
-
257
-
258
-
259
-
260
-
261
-
262
-
263
-
264
-
265
-
266
-
267
-
268
-
269
-
270
-
271
-
272
-
273
-
274
-
275
 |
 |

PART II
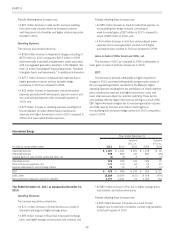
Partially offsetting these increases was:
• A $244 million decrease in GWh and thousand cubic feet
(Mcf) sales to retail customers due to less favorable weather
conditions in 2011 compared to the same period in 2010.
For the Carolinas and Midwest, weather statistics for both
heating degree days and cooling degree days in 2011 were
unfavorable compared to the same period in 2010. The year
2010 had the most cooling degree days on record and
December 2010 tied with December 1963 for the coldest
December on record in the Duke Energy Carolinas’ service
area (dating back to 1961).
Operating Expenses.
The increase was driven primarily by:
• A $178 million increase due to an additional impairment
charge related to the Edwardsport IGCC plant that is currently
under construction. See Note 4 to the Consolidated Financial
Statements, “Regulatory Matters,” for additional information;
and
• A $175 million increase in operating and maintenance
expenses primarily due to higher non-outage costs at nuclear
and fossil generation stations, higher storm costs, increased
scheduled outage costs at nuclear generation stations, and
increased costs related to the implementation of the SAW
program.
Other Income and Expenses, net.
The increase resulted primarily from a higher equity component
of AFUDC from additional capital spending for increased construction
expenditures related to new generation partially offset by lower
deferred returns.
EBIT.
As discussed above, the decrease resulted primarily from an
additional impairment charge related to the Edwardsport IGCC plant,
higher operating and maintenance expenses and less favorable
weather. These negative impacts were partially offset by overall net
higher retail rates and rate riders and higher wholesale power
revenues.
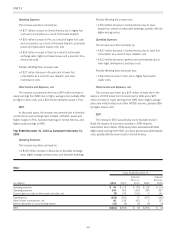
Matters Impacting Future USFE&G Results
Results of USFE&G are impacted by the completion of its major
generation fleet modernization projects. See Note 4 to the
Consolidated Financial Statements, “Regulatory Matters,” for a
discussion of the significant increase in the estimated cost of the 618
MW IGCC plant at Duke Energy Indiana’s Edwardsport Generating
Station. Additional updates to the cost estimate could occur through
the completion of the plant in 2012. Phase I and Phase II hearings
concluded on January 24, 2012. Final orders from the IURC on
Phase I and Phase II of the subdocket and the pending IGCC Rider
proceedings are expected no sooner than the end of the third quarter
2012. Duke Energy Indiana is unable to predict the ultimate
outcome of these proceedings. In the event the IURC disallows a
portion of the plant costs, including financing costs, or if cost
estimates for the plant increase, additional charges to expense, which
could be material, could occur.
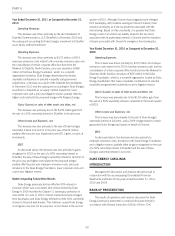
In January 2012, the NCUC and PSCSC approved Duke Energy
Carolinas’ proposed settlements in requests to increase electric rates
for its North Carolina and South Carolina customers. The settlement
agreements include combined base rate increases of approximately
$400 million that will be reflected in 2012 earnings.
Duke Energy Carolinas plans to file rate cases in North Carolina
and South Carolina during 2012. Duke Energy Ohio plans to file
electric transmission and distribution and gas rate cases in 2012.
Duke Energy Indiana is evaluating the need for a rate case in 2012
or 2013. These planned rates cases are needed to recover
investments in Duke Energy’s ongoing infrastructure modernization
projects and operating costs.
Year Ended December 31, 2010 as Compared to December 31,
2009
Operating Revenues.
The increase was driven primarily by:
• A $374 million increase in net retail pricing and rate riders
primarily due to new retail base rates implemented in North
Carolina and South Carolina in the first quarter of 2010
resulting from the 2009 rate cases, an Ohio electric
distribution rate increase in July 2009, and a Kentucky gas
rate increase in January 2010;
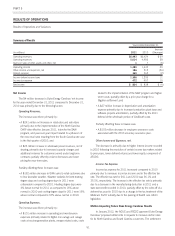
• A $308 million increase in sales to retail customers due to
favorable weather conditions in 2010 compared to 2009. For
the Carolinas and Midwest, weather statistics for both heating
degree days and cooling degree days in 2010 were favorable
compared to 2009. The year 2010 had the most cooling
degree days on record in the Duke Energy Carolinas’ service
area (dating back to 1961);
• A $282 million increase in fuel revenues (including emission
allowances) driven primarily by increased demand from
electric retail customers resulting from favorable weather
conditions, and higher fuel rates for electric retail customers in
North Carolina, partially offset by lower fuel rates for electric
retail customers in the Midwest and South Carolina, and lower
natural gas fuel rates in Ohio and Kentucky. Fuel revenues
represent sales to retail and wholesale customers;
• A $54 million net increase in wholesale power revenues, net
of sharing, primarily due to increases in charges for capacity,
increased sales volumes due to weather conditions in 2010
and the addition of new customers served under long-term
contracts; and
• A $40 million increase in weather adjusted sales volumes to
electric retail customers reflecting increased demand, primarily
in the industrial sector, and slight growth in the number of
residential and general service electric customers in the
USFE&G service territory. The number of electric residential
customers in 2010 has increased by approximately 10,000 in
the Carolinas and by approximately 7,000 in the Midwest
compared to 2009.
45