Duke Energy 2011 Annual Report Download - page 17
Download and view the complete annual report
Please find page 17 of the 2011 Duke Energy annual report below. You can navigate through the pages in the report by either clicking on the pages listed below, or by using the keyword search tool below to find specific information within the annual report.-
 1
1 -
2
-
3
-
4
-
5
-
6
-
 7
7 -
 8
8 -
 9
9 -
 10
10 -
 11
11 -
 12
12 -
 13
13 -
 14
14 -
 15
15 -
 16
16 -
 17
17 -
 18
18 -
 19
19 -
 20
20 -
 21
21 -
 22
22 -
 23
23 -
 24
24 -
 25
25 -
 26
26 -
 27
27 -
28
-
29
-
30
-
31
-
32
-
33
-
34
-
35
-
36
-
37
-
38
-
39
-
40
-
41
-
42
-
43
-
44
-
45
-
46
-
47
-
48
-
49
-
50
-
51
-
52
-
53
-
54
-
55
-
56
-
57
-
58
-
59
-
60
-
61
-
62
-
63
-
64
-
65
-
66
-
67
-
68
-
69
-
70
-
71
-
72
-
73
-
74
-
75
-
76
-
77
-
78
-
79
-
80
-
81
-
82
-
83
-
84
-
85
-
86
-
87
-
88
-
89
-
90
-
91
-
92
-
93
-
94
-
95
-
96
-
97
-
98
-
99
-
100
-
101
-
102
-
103
-
104
-
105
-
106
-
107
-
108
-
109
-
110
-
111
-
112
-
113
-
114
-
115
-
116
-
117
-
118
-
119
-
120
-
121
-
122
-
123
-
124
-
125
-
126
-
127
-
128
-
129
-
130
-
131
-
132
-
133
-
134
-
135
-
136
-
137
-
138
-
139
-
140
-
141
-
142
-
143
-
144
-
145
-
146
-
147
-
148
-
149
-
150
-
151
-
152
-
153
-
154
-
155
-
156
-
157
-
158
-
159
-
160
-
161
-
162
-
163
-
164
-
165
-
166
-
167
-
168
-
169
-
170
-
171
-
172
-
173
-
174
-
175
-
176
-
177
-
178
-
179
-
180
-
181
-
182
-
183
-
184
-
185
-
186
-
187
-
188
-
189
-
190
-
191
-
192
-
193
-
194
-
195
-
196
-
197
-
198
-
199
-
200
-
201
-
202
-
203
-
204
-
205
-
206
-
207
-
208
-
209
-
210
-
211
-
212
-
213
-
214
-
215
-
216
-
217
-
218
-
219
-
220
-
221
-
222
-
223
-
224
-
225
-
226
-
227
-
228
-
229
-
230
-
231
-
232
-
233
-
234
-
235
-
236
-
237
-
238
-
239
-
240
-
241
-
242
-
243
-
244
-
245
-
246
-
247
-
248
-
249
-
250
-
251
-
252
-
253
-
254
-
255
-
256
-
257
-
258
-
259
-
260
-
261
-
262
-
263
-
264
-
265
-
266
-
267
-
268
-
269
-
270
-
271
-
272
-
273
-
274
-
275
 |
 |

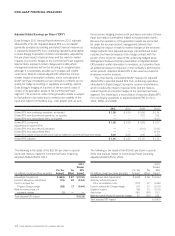
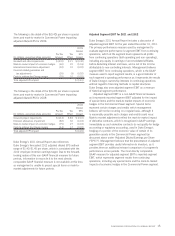
The following is the detail of the $(0.40) per share in special
items and mark-to-market in Commercial Power impacting
adjusted diluted EPS for 2009:
2009
Diluted
Pre-Tax Tax EPS
(In millions, except per-share amounts) Amount Effect Impact
Goodwill and other impairments $ (431) $ 21 $ (0.32)
Mark-to-market impact of economic hedges (60) 22 (0.03)
International transmission adjustment (32) 10 (0.02)
Crescent related guarantees and
tax adjustments (26) (3) (0.02)
Costs to achieve the Cinergy merger (25) 10 (0.01)
Total adjusted EPS impact $ (0.40)
The following is the detail of the $(0.20) per share in special
items and mark-to-market in Commercial Power impacting
adjusted diluted EPS for 2008:
2008
Diluted
Pre-Tax Tax EPS
(In millions, except per-share amounts) Amount Effect Impact
Crescent project impairments $ (214) $ 83 $ (0.10)
Emission allowances impairment (82) 30 (0.04)
Mark-to-market impact of economic hedges (75) 27 (0.04)
Costs to achieve the Cinergy merger (44) 17 (0.02)
Total adjusted EPS impact $ (0.20)
Duke Energy’s 2011 Annual Report also references
Duke Energy’s forecasted 2012 adjusted diluted EPS outlook
range of $1.40-$1.45 per share, which is consistent with the
2012 employee incentive earnings target. Due to the forward-
looking nature of this non-GAAP financial measure for future
periods, information to reconcile it to the most directly
comparable GAAP financial measure is not available at this time,
as management is unable to project special items or mark-to-
market adjustments for future periods.
Adjusted Segment EBIT for 2011 and 2012
Duke Energy’s 2011 Annual Report includes a discussion of
adjusted segment EBIT for the year ended December 31, 2011.
The primary performance measure used by management to
evaluate segment performance is segment EBIT from continuing
operations, which at the segment level represents all profits
from continuing operations (both operating and non-operating),
including any equity in earnings of unconsolidated affiliates,
before deducting interest and taxes, and is net of the income
attributable to non-controlling interests. Management believes
segment EBIT from continuing operations, which is the GAAP
measure used to report segment results, is a good indicator of
each segment’s operating performance as it represents the results
of Duke Energy’s ownership interests in continuing operations
without regard to financing methods or capital structures.
Duke Energy also uses adjusted segment EBIT as a measure
of historical segment performance.
Adjusted segment EBIT is a non-GAAP financial measure
as it represents reported segment EBIT adjusted for the impact
of special items and the mark-to market impacts of economic
hedges in the Commercial Power segment. Special items
represent certain charges and credits which management
believes will not be recurring on a regular basis, although it
is reasonably possible such charges and credits could recur.
Mark-to-market adjustments reflect the mark-to-market impact
of derivative contracts, which is recognized in GAAP earnings
immediately as such derivative contracts do not qualify for hedge
accounting or regulatory accounting, used in Duke Energy’s
hedging of a portion of the economic value of certain of its
generation assets in the Commercial Power segment (as
discussed above under “Adjusted Diluted Earnings per Share
(“EPS”)”). Management believes that the presentation of adjusted
segment EBIT provides useful information to investors, as it
provides them an additional relevant comparison of a segment’s
performance across periods. The most directly comparable
GAAP measure for adjusted segment EBIT is reported segment
EBIT, which represents segment results from continuing
operations, including any special items and the mark-to-market
impacts of economic hedges in the Commercial Power segment.
DUKE ENERGY CORPORATION 2011 ANNUAL REPORT 15