Duke Energy 2011 Annual Report Download - page 173
Download and view the complete annual report
Please find page 173 of the 2011 Duke Energy annual report below. You can navigate through the pages in the report by either clicking on the pages listed below, or by using the keyword search tool below to find specific information within the annual report.-
 1
1 -
2
-
3
-
4
-
5
-
6
-
7
-
8
-
9
-
10
-
11
-
12
-
13
-
14
-
15
-
16
-
17
-
18
-
19
-
20
-
21
-
22
-
23
-
24
-
25
-
26
-
27
-
28
-
29
-
30
-
31
-
32
-
33
-
34
-
35
-
36
-
37
-
38
-
39
-
40
-
41
-
42
-
43
-
44
-
45
-
46
-
47
-
48
-
49
-
50
-
51
-
52
-
53
-
54
-
55
-
56
-
57
-
58
-
59
-
60
-
61
-
62
-
63
-
64
-
65
-
66
-
67
-
68
-
69
-
70
-
71
-
72
-
73
-
74
-
75
-
76
-
77
-
78
-
79
-
80
-
81
-
82
-
83
-
84
-
85
-
86
-
87
-
88
-
89
-
90
-
91
-
92
-
93
-
94
-
95
-
96
-
97
-
98
-
99
-
100
-
101
-
102
-
103
-
104
-
105
-
106
-
107
-
108
-
109
-
110
-
111
-
112
-
113
-
114
-
115
-
116
-
117
-
118
-
119
-
120
-
121
-
122
-
123
-
124
-
125
-
126
-
127
-
128
-
129
-
130
-
131
-
132
-
133
-
134
-
135
-
136
-
137
-
138
-
139
-
140
-
141
-
142
-
143
-
144
-
145
-
146
-
147
-
148
-
149
-
150
-
151
-
152
-
153
-
154
-
155
-
156
-
157
-
158
-
159
-
160
-
161
-
162
-
 163
163 -
 164
164 -
 165
165 -
 166
166 -
 167
167 -
 168
168 -
 169
169 -
 170
170 -
 171
171 -
 172
172 -
 173
173 -
 174
174 -
 175
175 -
 176
176 -
 177
177 -
 178
178 -
 179
179 -
 180
180 -
 181
181 -
 182
182 -
 183
183 -
184
-
185
-
186
-
187
-
188
-
189
-
190
-
191
-
192
-
193
-
194
-
195
-
196
-
197
-
198
-
199
-
200
-
201
-
202
-
203
-
204
-
205
-
206
-
207
-
208
-
209
-
210
-
211
-
212
-
213
-
214
-
215
-
216
-
217
-
218
-
219
-
220
-
221
-
222
-
223
-
224
-
225
-
226
-
227
-
228
-
229
-
230
-
231
-
232
-
233
-
234
-
235
-
236
-
237
-
238
-
239
-
240
-
241
-
242
-
243
-
244
-
245
-
246
-
247
-
248
-
249
-
250
-
251
-
252
-
253
-
254
-
255
-
256
-
257
-
258
-
259
-
260
-
261
-
262
-
263
-
264
-
265
-
266
-
267
-
268
-
269
-
270
-
271
-
272
-
273
-
274
-
275
 |
 |

PART II
DUKE ENERGY CORPORATION •DUKE ENERGY CAROLINAS, LLC •DUKE ENERGY OHIO, INC. •DUKE ENERGY INDIANA, INC.
Combined Notes to Consolidated Financial Statements – (Continued)
unobservable inputs (i.e., Level 3 inputs) as defined by the
accounting guidance for fair value measurements.
Duke Energy Ohio.
Duke Energy Ohio early adopted the revised goodwill
impairment accounting guidance, discussed above, during the third
quarter of 2011 and applied this revised guidance to its August 31,
2011 annual goodwill impairment test. Duke Energy Ohio’s
qualitative assessment included, among other things, reviews of
current forecasts and recent fair value calculations, updates to
weighted average cost of capital calculations and consideration of
overall economic factors and recent financial performance. Duke
Energy Ohio determined it was more likely than not that the fair value
of each of its reporting units exceeded their carrying value at
August 31, 2011 and that the two step goodwill impairment test was
not required.
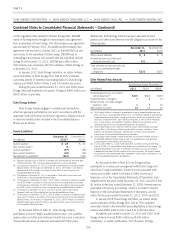
In the second quarter of 2010, based on circumstances
discussed above for Duke Energy, management determined that is
was more likely than not that the fair value of Duke Energy Ohio’s
non-regulated Midwest generation reporting unit was less than its
carrying value. Accordingly, Duke Energy Ohio also impaired its entire
goodwill balance of $461 million related to this reporting unit during
the second quarter of 2010. Also, as discussed above, Duke Energy
Ohio recorded $160 million of pre-tax impairment charges related to
certain generating assets and emission allowances primarily
associated with these generation assets in the Midwest to write-down
the value of these assets to their estimated fair value.
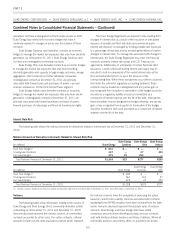
In the second quarter of 2010, goodwill for Ohio Transmission
and Distribution (Ohio T&D) was also analyzed. The fair value of the
Ohio T&D reporting unit is impacted by a multitude of factors,
including current and forecasted customer demand, discount rates,
valuation of peer companies, and regulatory and legislative
developments. Management periodically updates the load forecasts to
reflect current trends and expectations based on the current
environment and future assumptions. The spring and summer 2010
load forecast indicated that load would not return to 2007 weather-
normalized levels for several more years. Based on the results of the
second quarter 2010 impairment analysis, the fair value of the Ohio
T&D reporting unit was $216 million below its book value at Duke
Energy Ohio and $40 million higher than its book value at Duke
Energy. Accordingly, this goodwill impairment charge was only
recorded by Duke Energy Ohio.
For the same reasons discussed above, during 2009, in
connection with the annual goodwill impairment test, Duke Energy
Ohio recorded an approximate $727 million goodwill impairment
charge to write-down the carrying value of Duke Energy Ohio’s
non-regulated Midwest generation reporting unit to its implied fair
value. Additionally, in 2009 and as a result of factors similar to those
described above, Duke Energy Ohio recorded $42 million of pre-tax
impairment charges related to certain non-regulated generating assets
in the Midwest to write-down the value of these assets to their
estimated fair value.
The fair value of Duke Energy Ohio’s Ohio T&D reporting unit for
which an impairment was recorded was determined using significant
unobservable inputs (i.e., Level 3 inputs) as defined by the
accounting guidance for fair value measurements.
Duke Energy Ohio relied heavily on the income approach to
estimate the fair value of the impaired assets.
All of the above impairment charges are recorded in Goodwill
and Other Impairment Charges on Duke Energy Ohio’s Consolidated
Statements of Operations.
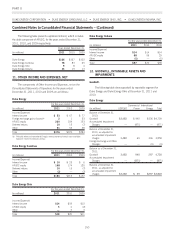
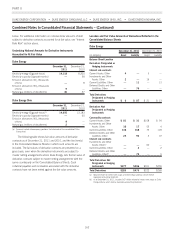
Intangibles.
The carrying amount and accumulated amortization of
intangible assets as of December 31, 2011 and 2010 are as follows:
December 31, 2011
(in millions) Duke Energy
Duke Energy
Ohio
Duke Energy
Indiana
Emission allowances $66 $29 $37
Gas, coal and power contracts 295 271 24
Wind development rights 137 — —
Other 72 10 —
Total gross carrying
amount 570 310 61
Accumulated amortization —
gas, coal and power
contracts (169) (158) (11)
Accumulated amortization —
wind development rights (7) — —
Accumulated amortization —
other (31) (9) —
Total accumulated
amortization (207) (167) (11)
Total intangible assets, net $363 $143 $50
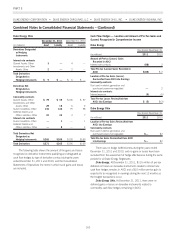
December 31, 2010
(in millions) Duke Energy
Duke Energy
Ohio
Duke Energy
Indiana
Emission allowances $ 175 $ 125 $49
Gas, coal and power contracts 295 271 24
Wind development rights 119 — —
Other 71 9 —
Total gross carrying amount 660 405 73
Accumulated amortization —
gas, coal and power contracts (157) (148) (9)
Accumulated amortization —
wind development rights (5) — —
Accumulated amortization —
other (31) (9) —
Total accumulated
amortization (193) (157) (9)
Total intangible assets, net $ 467 $ 248 $64
153