Duke Energy 2011 Annual Report Download - page 137
Download and view the complete annual report
Please find page 137 of the 2011 Duke Energy annual report below. You can navigate through the pages in the report by either clicking on the pages listed below, or by using the keyword search tool below to find specific information within the annual report.
PART II
DUKE ENERGY CORPORATION •DUKE ENERGY CAROLINAS, LLC •DUKE ENERGY OHIO, INC. •DUKE ENERGY INDIANA, INC.
Combined Notes to Consolidated Financial Statements – (Continued)
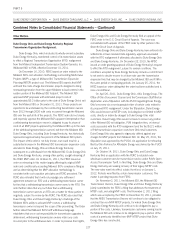
Business Segment Data
Unaffiliated
Revenues(a)
Segment EBIT/
Consolidated
(Loss) Income
Before
Income Taxes
Depreciation and
Amortization
Capital
Expenditures
Segment
Assets
Year Ended December 31, 2011
Franchised Electric and Gas $1,474 $ 327 $168 $375 $ 6,293
Commercial Power(f) 1,707 133 167 124 4,740
Total reportable segments 3,181 460 335 499 11,033
Other — (80) — — 259
Eliminations and reclassifications — — — — (353)
Interest expense — (104) — — —
Interest income and other —14 ———
Total consolidated $3,181 $ 290 $335 $499 $10,939
Year Ended December 31, 2010
Franchised Electric and Gas(c)(d) $1,623 $ 137 $226 $353 $ 6,258
Commercial Power(e)(f) 1,706 (262) 174 93 4,821
Total reportable segments 3,329 (125) 400 446 11,079
Other(b) — (93) — — 192
Eliminations and reclassifications — — — — (247)
Interest expense — (109) — — —
Interest income and other — 18 — — —
Total consolidated $3,329 $(309) $400 $446 $11,024
Year Ended December 31, 2009
Franchised Electric and Gas(c) $1,578 $ 283 $205 $294 $ 6,091
Commercial Power(e) 1,810 (352) 179 139 5,489
Total reportable segments 3,338 (69) 384 433 11,580
Other — (64) — — 4
Eliminations and reclassifications — — — — (73)
Interest expense — (117) — — —
Interest income and other — 10 — — —
Total consolidated $3,338 $(240) $384 $433 $11,511
(a) There was an insignificant amount of intersegment revenues for the years ended December 31, 2011, 2010 and 2009.
(b) During 2010, a $24 million expense was recorded related to the 2010 voluntary severance and the consolidation of certain corporate office functions from the Midwest to Charlotte,
North Carolina (see Note 19).
(c) On July 8, 2009, the PUCO approved a $55 million annual increase in rates for electric delivery service. These new rates were effective July 13, 2009. Additionally, on December 29,
2009, the KPSC approved a $13 million increase in annual base natural gas rates. New rates went into effect January 4, 2010.
(d) In the second quarter of 2010, Franchised Electric and Gas recorded an impairment charge of $216 million related to the Ohio Transmission and Distribution reporting unit. This
impairment charge was not applicable to Duke Energy as this reporting unit has a lower carrying value at Duke Energy. See Note 12 for additional information.
(e) As discussed in Note 12, during the year ended December 31, 2010, Commercial Power recorded impairment charges of $621 million, which consisted of a $461 million goodwill
impairment charge associated with the non-regulated Midwest generation operations and a $160 million charge to write-down the value of certain non-regulated Midwest generating
assets and emission allowances primarily associated with these generation assets. During the year ended December 31, 2009, Commercial Power recorded impairment charges of $769
million, which consisted of a $727 million goodwill impairment charge associated with the non-regulated Midwest generation operations and a $42 million charge to write-down the
value of certain generating assets in the Midwest to their estimated fair value.
(f) Duke Energy Ohio earned approximately 24% and 13% of its consolidated operating revenues from PJM Interconnection, LLC (PJM) in 2011 and 2010, respectively. These revenues
relate to the sale of capacity and electricity from Commercial Power’s gas-fired non-regulated generation assets. In 2009 no single counterparty contributed 10% or more of consolidated
operating revenue.
117


