Duke Energy 2011 Annual Report Download - page 82
Download and view the complete annual report
Please find page 82 of the 2011 Duke Energy annual report below. You can navigate through the pages in the report by either clicking on the pages listed below, or by using the keyword search tool below to find specific information within the annual report.-
 1
1 -
2
-
3
-
4
-
5
-
6
-
7
-
8
-
9
-
10
-
11
-
12
-
13
-
14
-
15
-
16
-
17
-
18
-
19
-
20
-
21
-
22
-
23
-
24
-
25
-
26
-
27
-
28
-
29
-
30
-
31
-
32
-
33
-
34
-
35
-
36
-
37
-
38
-
39
-
40
-
41
-
42
-
43
-
44
-
45
-
46
-
47
-
48
-
49
-
50
-
51
-
52
-
53
-
54
-
55
-
56
-
57
-
58
-
59
-
60
-
61
-
62
-
63
-
64
-
65
-
66
-
67
-
68
-
69
-
70
-
71
-
 72
72 -
 73
73 -
 74
74 -
 75
75 -
 76
76 -
 77
77 -
 78
78 -
 79
79 -
 80
80 -
 81
81 -
 82
82 -
 83
83 -
 84
84 -
 85
85 -
 86
86 -
 87
87 -
 88
88 -
 89
89 -
 90
90 -
 91
91 -
 92
92 -
93
-
94
-
95
-
96
-
97
-
98
-
99
-
100
-
101
-
102
-
103
-
104
-
105
-
106
-
107
-
108
-
109
-
110
-
111
-
112
-
113
-
114
-
115
-
116
-
117
-
118
-
119
-
120
-
121
-
122
-
123
-
124
-
125
-
126
-
127
-
128
-
129
-
130
-
131
-
132
-
133
-
134
-
135
-
136
-
137
-
138
-
139
-
140
-
141
-
142
-
143
-
144
-
145
-
146
-
147
-
148
-
149
-
150
-
151
-
152
-
153
-
154
-
155
-
156
-
157
-
158
-
159
-
160
-
161
-
162
-
163
-
164
-
165
-
166
-
167
-
168
-
169
-
170
-
171
-
172
-
173
-
174
-
175
-
176
-
177
-
178
-
179
-
180
-
181
-
182
-
183
-
184
-
185
-
186
-
187
-
188
-
189
-
190
-
191
-
192
-
193
-
194
-
195
-
196
-
197
-
198
-
199
-
200
-
201
-
202
-
203
-
204
-
205
-
206
-
207
-
208
-
209
-
210
-
211
-
212
-
213
-
214
-
215
-
216
-
217
-
218
-
219
-
220
-
221
-
222
-
223
-
224
-
225
-
226
-
227
-
228
-
229
-
230
-
231
-
232
-
233
-
234
-
235
-
236
-
237
-
238
-
239
-
240
-
241
-
242
-
243
-
244
-
245
-
246
-
247
-
248
-
249
-
250
-
251
-
252
-
253
-
254
-
255
-
256
-
257
-
258
-
259
-
260
-
261
-
262
-
263
-
264
-
265
-
266
-
267
-
268
-
269
-
270
-
271
-
272
-
273
-
274
-
275
 |
 |

PART II
Energy were to decide to repatriate foreign generated and held cash,
recognition of material U.S. federal income tax liabilities could be
required.
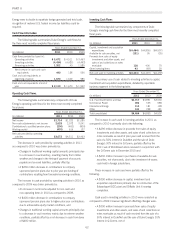
Cash Flow Information
The following table summarizes Duke Energy’s cash flows for
the three most recently completed fiscal years:
Years Ended December 31,
(in millions) 2011 2010 2009
Cash flows provided by (used in):
Operating activities $3,672 $ 4,511 $ 3,463
Investing activities (4,434) (4,423) (4,492)
Financing activities 1,202 40 1,585
Net increase in cash and cash
equivalents 440 128 556
Cash and cash equivalents at
beginning of period 1,670 1,542 986
Cash and cash equivalents at end of
year $2,110 $ 1,670 $ 1,542
Operating Cash Flows.
The following table summarizes key components of Duke
Energy’s operating cash flows for the three most recently completed
fiscal years:
Years Ended December 31,
(in millions) 2011 2010 2009
Net income $1,714 $1,323 $1,085
Non-cash adjustments to net income 2,628 2,972 3,041
Contributions to qualified pension plans (200) (400) (800)
Working capital (470) 616 137
Net cash provided by operating
activities $3,672 $4,511 $3,463
The decrease in cash provided by operating activities in 2011
as compared to 2010 was driven primarily by:
• Changes in traditional working capital amounts principally due
to a increase in coal inventory, resulting mainly from milder
weather and changes in the timing of payment of accounts
payable and accrued liabilities, partially offset by;
• A $200 million decrease in contributions to company
sponsored pension plans due to prior year pre-funding of
contributions resulting from favorable borrowing conditions.
The increase in cash provided by operating activities in 2010 as
compared to 2009 was driven primarily by:
• An increase in net income adjusted for non-cash and
non-operating items in 2010 as compared to 2009,
• A $400 million decrease in contributions to company
sponsored pension plans due to higher prior year contributions
due to unfavorable equity market conditions, and
• Changes in traditional working capital amounts principally due
to a decrease in coal inventory mainly due to extreme weather
conditions, partially offset by a net decrease in cash from taxes
of $480 million.
Investing Cash Flows
The following table summarizes key components of Duke
Energy’s investing cash flows for the three most recently completed
fiscal years:
Years Ended December 31,
(in millions) 2011 2010 2009
Capital, investment and acquisition
expenditures $(4,464) $(4,855) $(4,557)
Available for sale securities, net (131) 95 (25)
Proceeds from sales of equity
investments and other assets, and
sales of and collections on notes
receivable 118 406 70
Other investing items 43 (69) 20
Net cash used in investing activities $(4,434) $(4,423) $(4,492)
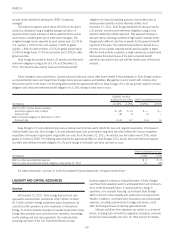
The primary use of cash related to investing activities is capital,
investment and acquisition expenditures, detailed by reportable
business segment in the following table.
Years Ended December 31,
(in millions) 2011 2010 2009
U.S. Franchised Electric and Gas $3,717 $3,891 $3,560
Commercial Power 492 525 688
International Energy 114 181 128
Other 141 258 181
Total consolidated $4,464 $4,855 $4,557
The increase in cash used in investing activities in 2011 as
compared to 2010 is primarily due to the following:
• A $290 million decrease in proceeds from sales of equity
investments and other assets, and sales of and collections on
notes receivable as result of prior year cash received from the
sale of a 50% interest in DukeNet and the sale of Duke
Energy’s 30% interest in Q-Comm, partially offset by the
2011 sale of Windstream stock received in conjunction with
the Q-Comm sale in December 2010 and
• A $230 million increase in purchases of available-for-sale
securities, net of proceeds, due to the investment of excess
cash held in foreign jurisdictions.
These increases in cash used were partially offset by the
following:
• A $390 million decrease in capital, investment and
acquisition expenditures primarily due to construction of the
Edwardsport IGCC plant and Cliffside Unit 6 nearing
completion.
Cash used in investing activities in 2010 were consistent as
compared to 2009. However significant offsetting changes were:
• A $300 million increase in proceeds from sales of equity
investments and other assets, and sales of and collections on
notes receivable as result of cash received from the sale of a
50% interest in DukeNet and the sale of Duke Energy’s 30%
interest in Q-Comm, net of
62