Duke Energy 2011 Annual Report Download - page 112
Download and view the complete annual report
Please find page 112 of the 2011 Duke Energy annual report below. You can navigate through the pages in the report by either clicking on the pages listed below, or by using the keyword search tool below to find specific information within the annual report.-
 1
1 -
2
-
3
-
4
-
5
-
6
-
7
-
8
-
9
-
10
-
11
-
12
-
13
-
14
-
15
-
16
-
17
-
18
-
19
-
20
-
21
-
22
-
23
-
24
-
25
-
26
-
27
-
28
-
29
-
30
-
31
-
32
-
33
-
34
-
35
-
36
-
37
-
38
-
39
-
40
-
41
-
42
-
43
-
44
-
45
-
46
-
47
-
48
-
49
-
50
-
51
-
52
-
53
-
54
-
55
-
56
-
57
-
58
-
59
-
60
-
61
-
62
-
63
-
64
-
65
-
66
-
67
-
68
-
69
-
70
-
71
-
72
-
73
-
74
-
75
-
76
-
77
-
78
-
79
-
80
-
81
-
82
-
83
-
84
-
85
-
86
-
87
-
88
-
89
-
90
-
91
-
92
-
93
-
94
-
95
-
96
-
97
-
98
-
99
-
100
-
101
-
 102
102 -
 103
103 -
 104
104 -
 105
105 -
 106
106 -
 107
107 -
 108
108 -
 109
109 -
 110
110 -
 111
111 -
 112
112 -
 113
113 -
 114
114 -
 115
115 -
 116
116 -
 117
117 -
 118
118 -
 119
119 -
 120
120 -
 121
121 -
 122
122 -
123
-
124
-
125
-
126
-
127
-
128
-
129
-
130
-
131
-
132
-
133
-
134
-
135
-
136
-
137
-
138
-
139
-
140
-
141
-
142
-
143
-
144
-
145
-
146
-
147
-
148
-
149
-
150
-
151
-
152
-
153
-
154
-
155
-
156
-
157
-
158
-
159
-
160
-
161
-
162
-
163
-
164
-
165
-
166
-
167
-
168
-
169
-
170
-
171
-
172
-
173
-
174
-
175
-
176
-
177
-
178
-
179
-
180
-
181
-
182
-
183
-
184
-
185
-
186
-
187
-
188
-
189
-
190
-
191
-
192
-
193
-
194
-
195
-
196
-
197
-
198
-
199
-
200
-
201
-
202
-
203
-
204
-
205
-
206
-
207
-
208
-
209
-
210
-
211
-
212
-
213
-
214
-
215
-
216
-
217
-
218
-
219
-
220
-
221
-
222
-
223
-
224
-
225
-
226
-
227
-
228
-
229
-
230
-
231
-
232
-
233
-
234
-
235
-
236
-
237
-
238
-
239
-
240
-
241
-
242
-
243
-
244
-
245
-
246
-
247
-
248
-
249
-
250
-
251
-
252
-
253
-
254
-
255
-
256
-
257
-
258
-
259
-
260
-
261
-
262
-
263
-
264
-
265
-
266
-
267
-
268
-
269
-
270
-
271
-
272
-
273
-
274
-
275
 |
 |

PART II
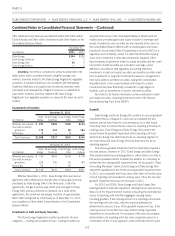
DUKE ENERGY OHIO, INC.
Consolidated Statements of Cash Flows
Years Ended December 31,
(In millions) 2011 2010 2009
CASH FLOWS FROM OPERATING ACTIVITIES
Net income (loss) $ 194 $(441) $(426)
Adjustments to reconcile net income (loss) to net cash provided by operating activities:
Depreciation and amortization 338 403 386
Gains on sales of other assets and other, net (5) (3) (12)
Impairment of goodwill and other long-lived assets 89 837 769
Deferred income taxes 190 17 102
Contributions to qualified pension plans (48) (45) (210)
Accrued pension and other post-retirement benefit costs 14 12 13
(Increase) decrease in
Net realized and unrealized mark-to-market and hedging transactions (8) (18) 35
Receivables 108 (30) (77)
Inventory 11 15 (16)
Other current assets (24) 71 69
Increase (decrease) in
Accounts payable (32) (21) 8
Taxes accrued 825 18
Other current liabilities (3) 6 (15)
Other assets (61) 42 25
Other liabilities 47 (15) 24
Net cash provided by operating activities 818 855 693
CASH FLOWS FROM INVESTING ACTIVITIES
Capital expenditures (499) (446) (433)
Purchases of emission allowances (6) (12) (25)
Sales of emission allowances 713 37
Notes due from affiliate 79 (296) (184)
Change in restricted cash (26) —10
Other (4) 1—
Net cash used in investing activities (449) (740) (595)
CASH FLOWS FROM FINANCING ACTIVITIES
Proceeds from the issuance of long-term debt —34 813
Payments for the redemption of long-term debt (9) (36) (103)
Notes payable and commercial paper —(12) (279)
Notes payable to affiliate —— (63)
Dividends to parent (485) — (360)
Other (4) —(6)
Net cash (used in) provided by financing activities (498) (14) 2
Net (decrease) increase in cash and cash equivalents (129) 101 100
Cash and cash equivalents at beginning of period 228 127 27
Cash and cash equivalents at end of period $ 99 $ 228 $ 127
Supplemental Disclosures
Cash paid for interest, net of amount capitalized $ 100 $ 108 $ 112
Cash (refunded) paid for income taxes $(102) $114 $ 2
Significant non-cash transactions:
Accrued capital expenditures $43 $40 $64
See Notes to Consolidated Financial Statements
92