Duke Energy 2011 Annual Report Download - page 64
Download and view the complete annual report
Please find page 64 of the 2011 Duke Energy annual report below. You can navigate through the pages in the report by either clicking on the pages listed below, or by using the keyword search tool below to find specific information within the annual report.-
 1
1 -
2
-
3
-
4
-
5
-
6
-
7
-
8
-
9
-
10
-
11
-
12
-
13
-
14
-
15
-
16
-
17
-
18
-
19
-
20
-
21
-
22
-
23
-
24
-
25
-
26
-
27
-
28
-
29
-
30
-
31
-
32
-
33
-
34
-
35
-
36
-
37
-
38
-
39
-
40
-
41
-
42
-
43
-
44
-
45
-
46
-
47
-
48
-
49
-
50
-
51
-
52
-
53
-
 54
54 -
 55
55 -
 56
56 -
 57
57 -
 58
58 -
 59
59 -
 60
60 -
 61
61 -
 62
62 -
 63
63 -
 64
64 -
 65
65 -
 66
66 -
 67
67 -
 68
68 -
 69
69 -
 70
70 -
 71
71 -
 72
72 -
 73
73 -
 74
74 -
75
-
76
-
77
-
78
-
79
-
80
-
81
-
82
-
83
-
84
-
85
-
86
-
87
-
88
-
89
-
90
-
91
-
92
-
93
-
94
-
95
-
96
-
97
-
98
-
99
-
100
-
101
-
102
-
103
-
104
-
105
-
106
-
107
-
108
-
109
-
110
-
111
-
112
-
113
-
114
-
115
-
116
-
117
-
118
-
119
-
120
-
121
-
122
-
123
-
124
-
125
-
126
-
127
-
128
-
129
-
130
-
131
-
132
-
133
-
134
-
135
-
136
-
137
-
138
-
139
-
140
-
141
-
142
-
143
-
144
-
145
-
146
-
147
-
148
-
149
-
150
-
151
-
152
-
153
-
154
-
155
-
156
-
157
-
158
-
159
-
160
-
161
-
162
-
163
-
164
-
165
-
166
-
167
-
168
-
169
-
170
-
171
-
172
-
173
-
174
-
175
-
176
-
177
-
178
-
179
-
180
-
181
-
182
-
183
-
184
-
185
-
186
-
187
-
188
-
189
-
190
-
191
-
192
-
193
-
194
-
195
-
196
-
197
-
198
-
199
-
200
-
201
-
202
-
203
-
204
-
205
-
206
-
207
-
208
-
209
-
210
-
211
-
212
-
213
-
214
-
215
-
216
-
217
-
218
-
219
-
220
-
221
-
222
-
223
-
224
-
225
-
226
-
227
-
228
-
229
-
230
-
231
-
232
-
233
-
234
-
235
-
236
-
237
-
238
-
239
-
240
-
241
-
242
-
243
-
244
-
245
-
246
-
247
-
248
-
249
-
250
-
251
-
252
-
253
-
254
-
255
-
256
-
257
-
258
-
259
-
260
-
261
-
262
-
263
-
264
-
265
-
266
-
267
-
268
-
269
-
270
-
271
-
272
-
273
-
274
-
275
 |
 |

PART II
Noncontrolling interest amounts presented below includes only expenses and benefits related to EBIT of Duke Energy’s joint ventures. It
does not include the noncontrolling interest component related to interest and taxes of the joint ventures.
Segment EBIT, as discussed below, includes intercompany revenues and expenses that are eliminated in the Consolidated Financial
Statements.
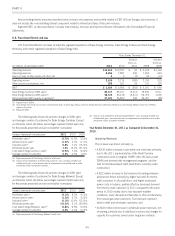
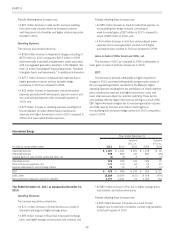
U.S. Franchised Electric and Gas
U.S. Franchised Electric and Gas includes the regulated operations of Duke Energy Carolinas, Duke Energy Indiana and Duke Energy
Kentucky and certain regulated operations of Duke Energy Ohio.
Years Ended December 31,
(in millions, except where noted) 2011 2010
Variance
2011 vs.
2010 2009
Variance
2010 vs.
2009
Operating revenues $10,619 $10,597 $ 22 $ 9,433 $1,164
Operating expenses 8,286 7,887 399 7,263 624
Gains on sales of other assets and other, net 25 (3) 20 (15)
Operating income 2,335 2,715 (380) 2,190 525
Other income and expenses, net 269 251 18 131 120
EBIT $2,604 $ 2,966 $ (362) $ 2,321 $ 645
Duke Energy Carolinas’ GWh sales(a) 82,127 85,441 (3,314) 79,830 5,611
Duke Energy Midwest’s GWh sales(a)(b) 58,104 60,418 (2,314) 56,753 3,665
Net proportional MW capacity in operation(c) 27,397 26,869 528 26,957 (88)
(a) Gigawatt-hours (GWh).
(b) Duke Energy Ohio (Ohio transmission and distribution only), Duke Energy Indiana and Duke Energy Kentucky collectively referred to as Duke Energy Midwest within this USFE&G
segment discussion.
(c) Megawatt (MW).
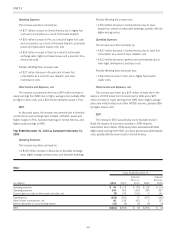
ThefollowingtableshowsthepercentchangesinGWhsales
and average number of customers for Duke Energy Carolinas. Except
as otherwise noted, the below percentages represent billed sales only
for the periods presented and are not weather normalized.
Increase (decrease) over prior year 2011 2010 2009
Residential sales(a) (5.7)% 10.2% (0.2)%
General service sales(a) (1.3)% 3.7% (1.1)%
Industrial sales(a) 0.8% 7.4% (15.2)%
Wholesale power sales 1.2% 12.2% (31.6)%
Total Duke Energy Carolinas’ sales(b) (3.9)% 7.0% (6.6)%
Average number of customers 0.3% 0.5% 0.5%
(a) Major components of Duke Energy Carolinas’ retail sales.
(b) Consists of all components of Duke Energy Carolinas’ sales, including all billed and
unbilled retail sales, and wholesale sales to incorporated municipalities and to public
and private utilities and power marketers.
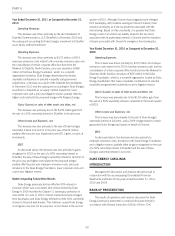
ThefollowingtableshowsthepercentchangesinGWhsales
and average number of customers for Duke Energy Midwest. Except
as otherwise noted, the below percentages represent billed sales only
for the periods presented and are not weather normalized.
Increase (decrease) over prior year 2011 2010 2009
Residential sales(a) (3.1)% 8.2% (4.3)%
General service sales(a) (1.3)% 2.7% (3.5)%
Industrial sales(a) (0.1)% 10.4% (15.0)%
Wholesale power sales (16.3)% 2.1% (20.8)%
Total Duke Energy Midwest’s sales(b) (3.8)% 6.5% (9.2)%
Average number of customers 0.2% 0.4% (0.3)%
(a) Major components of Duke Energy Midwest’s retail sales.
(b) Consists of all components of Duke Energy Midwest’s sales, including all billed and
unbilled retail sales, and wholesale sales to incorporated municipalities and to public
and private utilities and power marketers.
Year Ended December 31, 2011 as Compared to December 31,
2010
Operating Revenues.
The increase was driven primarily by:
• A $230 million increase in rate riders and retail rates primarily
due to the 2011 implementation of the North Carolina
construction work in progress (CWIP) rider, the save-a-watt
(SAW) and demand side management programs, and the
rider for the Edwardsport IGCC plant that is currently under
construction;
• A $22 million increase in fuel revenues (including emission
allowances) driven primarily by higher fuel rates for electric
retail customers in all jurisdictions, and higher purchased
power costs in Indiana, partially offset by decreased demand
from electric retail customers in 2011 compared to the same
period in 2010 mainly due to less favorable weather
conditions, lower demand and fuel rates in Ohio and Kentucky
from natural gas retail customers. Fuel revenues represent
sales to retail and wholesale customers; and
• An $18 million net increase in wholesale power revenues, net
of sharing, primarily due to additional volumes and charges for
capacity for customers served under long-term contracts.
44