Duke Energy 2011 Annual Report Download - page 209
Download and view the complete annual report
Please find page 209 of the 2011 Duke Energy annual report below. You can navigate through the pages in the report by either clicking on the pages listed below, or by using the keyword search tool below to find specific information within the annual report.-
 1
1 -
2
-
3
-
4
-
5
-
6
-
7
-
8
-
9
-
10
-
11
-
12
-
13
-
14
-
15
-
16
-
17
-
18
-
19
-
20
-
21
-
22
-
23
-
24
-
25
-
26
-
27
-
28
-
29
-
30
-
31
-
32
-
33
-
34
-
35
-
36
-
37
-
38
-
39
-
40
-
41
-
42
-
43
-
44
-
45
-
46
-
47
-
48
-
49
-
50
-
51
-
52
-
53
-
54
-
55
-
56
-
57
-
58
-
59
-
60
-
61
-
62
-
63
-
64
-
65
-
66
-
67
-
68
-
69
-
70
-
71
-
72
-
73
-
74
-
75
-
76
-
77
-
78
-
79
-
80
-
81
-
82
-
83
-
84
-
85
-
86
-
87
-
88
-
89
-
90
-
91
-
92
-
93
-
94
-
95
-
96
-
97
-
98
-
99
-
100
-
101
-
102
-
103
-
104
-
105
-
106
-
107
-
108
-
109
-
110
-
111
-
112
-
113
-
114
-
115
-
116
-
117
-
118
-
119
-
120
-
121
-
122
-
123
-
124
-
125
-
126
-
127
-
128
-
129
-
130
-
131
-
132
-
133
-
134
-
135
-
136
-
137
-
138
-
139
-
140
-
141
-
142
-
143
-
144
-
145
-
146
-
147
-
148
-
149
-
150
-
151
-
152
-
153
-
154
-
155
-
156
-
157
-
158
-
159
-
160
-
161
-
162
-
163
-
164
-
165
-
166
-
167
-
168
-
169
-
170
-
171
-
172
-
173
-
174
-
175
-
176
-
177
-
178
-
179
-
180
-
181
-
182
-
183
-
184
-
185
-
186
-
187
-
188
-
189
-
190
-
191
-
192
-
193
-
194
-
195
-
196
-
197
-
198
-
 199
199 -
 200
200 -
 201
201 -
 202
202 -
 203
203 -
 204
204 -
 205
205 -
 206
206 -
 207
207 -
 208
208 -
 209
209 -
 210
210 -
 211
211 -
 212
212 -
 213
213 -
 214
214 -
 215
215 -
 216
216 -
 217
217 -
 218
218 -
 219
219 -
220
-
221
-
222
-
223
-
224
-
225
-
226
-
227
-
228
-
229
-
230
-
231
-
232
-
233
-
234
-
235
-
236
-
237
-
238
-
239
-
240
-
241
-
242
-
243
-
244
-
245
-
246
-
247
-
248
-
249
-
250
-
251
-
252
-
253
-
254
-
255
-
256
-
257
-
258
-
259
-
260
-
261
-
262
-
263
-
264
-
265
-
266
-
267
-
268
-
269
-
270
-
271
-
272
-
273
-
274
-
275
 |
 |

PART II
DUKE ENERGY CORPORATION •DUKE ENERGY CAROLINAS, LLC •DUKE ENERGY OHIO, INC. •DUKE ENERGY INDIANA, INC.
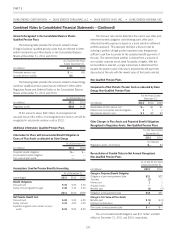
Combined Notes to Consolidated Financial Statements – (Continued)
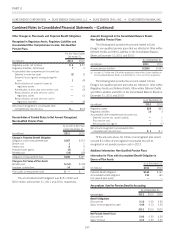
Amounts Recognized in the Consolidated Balance Sheets:
Qualified Pension Plans
The following table provides the amounts related to Duke
Energy’s qualified pension plans that are reflected in Other within
Investments and Other Assets and Other within Deferred Credits and
Other Liabilities on the Consolidated Balance Sheets at December 31,
2011 and 2010:
As of December 31,
(in millions) 2011 2010
Prefunded pension cost $— $101
Accrued pension liability (139) (165)
Net amount recognized $(139) $(64)
The following table provides the amounts related to Duke
Energy’s qualified pension plans that are reflected in Other within
Regulatory Assets and Deferred Debits and AOCI on the Consolidated
Balance Sheets at December 31, 2011 and 2010:
As of December 31,
(in millions) 2011 2010
Regulatory assets $1,411 $1,259
Accumulated other comprehensive (income) loss
Deferred income tax asset (73) (63)
Prior service cost 45
Net actuarial loss 201 141
Net amount recognized in accumulated other
comprehensive (income) loss(a) $ 132 $83
(a) Excludes accumulated other comprehensive income of $19 million and $17 million as
of December 31, 2011 and 2010, respectively, net of tax, associated with a Brazilian
retirement plan.
Of the amounts above, $98 million of unrecognized net
actuarial loss and $5 million of unrecognized prior service cost will be
recognized in net periodic pension costs in 2012.
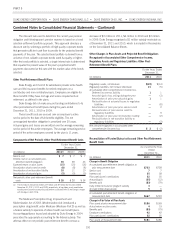
Additional Information: Qualified Pension Plans
Information for Plans with Accumulated Benefit Obligation in
Excess of Plan Assets
As of December 31,
(in millions) 2011 2010
Projected benefit obligation $— $1,052
Accumulated benefit obligation —956
Fair value of plan assets —951
Assumptions Used for Pension Benefits Accounting
As of December 31,
(percentages) 2011 2010 2009
Benefit Obligations
Discount rate 5.10 5.00 5.50
Salary increase (graded by age) 4.40 4.10 4.50
2011 2010 2009
Net Periodic Benefit Cost
Discount rate 5.00 5.50 6.50
Salary increase 4.10 4.50 4.50
Expected long-term rate of return on plan
assets 8.25 8.50 8.50
The discount rate used to determine the current year pension
obligation and following year’s pension expense is based on a bond
selection-settlement portfolio approach. This approach develops a
discount rate by selecting a portfolio of high quality corporate bonds
that generate sufficient cash flow to provide for the projected benefit
payments of the plan. The selected bond portfolio is derived from a
universe of non-callable corporate bonds rated Aa quality or higher.
After the bond portfolio is selected, a single interest rate is determined
that equates the present value of the plan’s projected benefit
payments discounted at this rate with the market value of the bonds
selected.
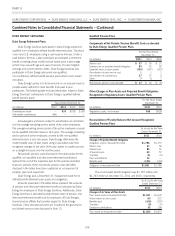
Non-Qualified Pension Plans
Components of Net Periodic Pension Costs: Non-Qualified Pension
Plans
For the Years Ended
December 31,
(in millions) 2011 2010 2009
Service cost $1 $1 $2
Interest cost on projected benefit obligation 8910
Amortization of prior service cost 222
Settlement credit ——(1)
Net periodic pension costs $11 $12 $13
189