Duke Energy 2011 Annual Report Download - page 4
Download and view the complete annual report
Please find page 4 of the 2011 Duke Energy annual report below. You can navigate through the pages in the report by either clicking on the pages listed below, or by using the keyword search tool below to find specific information within the annual report.-
 1
1 -
 2
2 -
 3
3 -
 4
4 -
 5
5 -
 6
6 -
 7
7 -
 8
8 -
 9
9 -
 10
10 -
 11
11 -
 12
12 -
 13
13 -
 14
14 -
 15
15 -
16
-
17
-
18
-
19
-
20
-
21
-
22
-
23
-
24
-
25
-
26
-
27
-
28
-
29
-
30
-
31
-
32
-
33
-
34
-
35
-
36
-
37
-
38
-
39
-
40
-
41
-
42
-
43
-
44
-
45
-
46
-
47
-
48
-
49
-
50
-
51
-
52
-
53
-
54
-
55
-
56
-
57
-
58
-
59
-
60
-
61
-
62
-
63
-
64
-
65
-
66
-
67
-
68
-
69
-
70
-
71
-
72
-
73
-
74
-
75
-
76
-
77
-
78
-
79
-
80
-
81
-
82
-
83
-
84
-
85
-
86
-
87
-
88
-
89
-
90
-
91
-
92
-
93
-
94
-
95
-
96
-
97
-
98
-
99
-
100
-
101
-
102
-
103
-
104
-
105
-
106
-
107
-
108
-
109
-
110
-
111
-
112
-
113
-
114
-
115
-
116
-
117
-
118
-
119
-
120
-
121
-
122
-
123
-
124
-
125
-
126
-
127
-
128
-
129
-
130
-
131
-
132
-
133
-
134
-
135
-
136
-
137
-
138
-
139
-
140
-
141
-
142
-
143
-
144
-
145
-
146
-
147
-
148
-
149
-
150
-
151
-
152
-
153
-
154
-
155
-
156
-
157
-
158
-
159
-
160
-
161
-
162
-
163
-
164
-
165
-
166
-
167
-
168
-
169
-
170
-
171
-
172
-
173
-
174
-
175
-
176
-
177
-
178
-
179
-
180
-
181
-
182
-
183
-
184
-
185
-
186
-
187
-
188
-
189
-
190
-
191
-
192
-
193
-
194
-
195
-
196
-
197
-
198
-
199
-
200
-
201
-
202
-
203
-
204
-
205
-
206
-
207
-
208
-
209
-
210
-
211
-
212
-
213
-
214
-
215
-
216
-
217
-
218
-
219
-
220
-
221
-
222
-
223
-
224
-
225
-
226
-
227
-
228
-
229
-
230
-
231
-
232
-
233
-
234
-
235
-
236
-
237
-
238
-
239
-
240
-
241
-
242
-
243
-
244
-
245
-
246
-
247
-
248
-
249
-
250
-
251
-
252
-
253
-
254
-
255
-
256
-
257
-
258
-
259
-
260
-
261
-
262
-
263
-
264
-
265
-
266
-
267
-
268
-
269
-
270
-
271
-
272
-
273
-
274
-
275
 |
 |

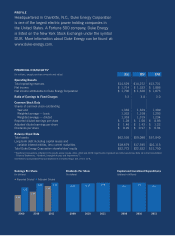
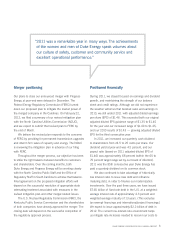
2011 was a remarkable year in many ways. The
achievements of the women and men of Duke Energy
speak volumes about our culture of safety, customer and
community service and excellent operational performance.
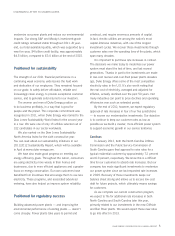
First, we achieved constructive regulatory outcomes. In
the Carolinas, we reached settlements to adjust customer
rates in order to recover expenses and capital investments
in our modernization program. State utility regulators
approved these settlements in early 2012, and the revised
rates are now in effect. In Ohio, we gained approval of our
Electric Security Plan (ESP). The new ESP gives us longer-
term clarity and the strategic flexibility we need to operate
in the state’s market-based system at a time of historically
low energy and capacity prices.
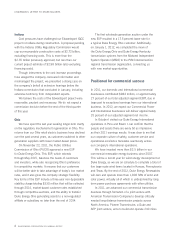
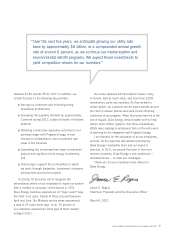
Second, Duke Energy’s generating fleet operated
exceptionally well throughout the year. Based on early
reports, our nuclear fleet had the nation’s lowest total
operating cost per kilowatt-hour (kWh) in 2011, and our
Catawba Nuclear Station was the nation’s most cost
efficient plant. In addition, our nuclear fleet recorded
a 92.95 percent capacity factor1
, above 90 percent for
the 12th consecutive year. Our regulated fossil fleet
achieved commercial availability2 of 87.8 percent in
2011, consistent with excellent past performance. For
the third consecutive year, our Midwest gas-fired fleet
achieved record generation levels and our U.S. commercial
fleet exceeded its operational targets. Simply put, these
numbers mean that our generation assets were available
when we needed them most — and they reflect the
discipline and diligence of our generation teams.
Third, for the sixth consecutive year, we improved
on an important safety metric, Total Incident Case
Rate3
, which was 4 percent lower than in 2010. This
performance reflects the success of our “safety-first”
culture and the programs we have in place to reward
employees for behaviors that save money and lives. In my
letter last year, I discussed our determination to eliminate
contractor fatalities. We succeeded in 2011, ending the
year with no employee or contractor work-related fatalities.
Our focus on safety will continue to be a top priority.
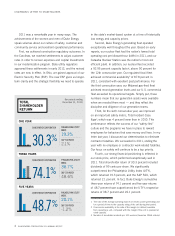
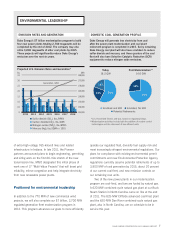
Fourth, our strong financial positioning is reflected in
our stock price, which performed exceptionally well in
2011. Total shareholder return of 30.3 percent included
dividends of 99 cents per share. We significantly
outperformed the Philadelphia Utility Index (UTY),
which returned 19.3 percent, and the S&P 500, which
returned 2.1 percent. In fact, Duke Energy’s cumulative
three-year returns of 74.1 percent and five-year returns
of 48.7 percent have outperformed the UTY’s respective
returns of 38.7 percent and 20.1 percent.
1 The ratio of the average operating load of an electric power generating unit
for a period of time to the capacity rating of the unit during that period.
2 Commercial availability is the ratio of the margin (in dollars) available
from operating a unit, compared with the margin if the unit is operated at
rated capacity.
3 Number of recordable incidents per 100 workers (based on OSHA criteria).
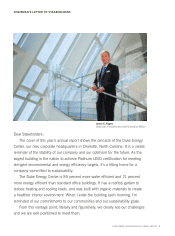
CHAIRMAN’S LETTER TO STAKEHOLDERS
TOTAL
SHAREHOLDER
RETURN
(for periods ending
December 31, 2011)
DUKE ENERGY CORPORATION
30.3%
ONE YEAR
PHILADELPHIA UTILITY
INDEX
19.3%
S&P 500 INDEX
2.1%
THREE YEARS
PHILADELPHIA UTILITY
INDEX
38.7%
S&P 500 INDEX
48.6%
DUKE ENERGY CORPORATION
74.1%
FIVE YEARS
PHILADELPHIA UTILITY
INDEX
20.1%
S&P 500 INDEX
-1.2%
DUKE ENERGY CORPORATION
48.7%
2 DUKE ENERGY CORPORATION 2011 ANNUAL REPORT