Duke Energy 2011 Annual Report Download - page 81
Download and view the complete annual report
Please find page 81 of the 2011 Duke Energy annual report below. You can navigate through the pages in the report by either clicking on the pages listed below, or by using the keyword search tool below to find specific information within the annual report.-
 1
1 -
2
-
3
-
4
-
5
-
6
-
7
-
8
-
9
-
10
-
11
-
12
-
13
-
14
-
15
-
16
-
17
-
18
-
19
-
20
-
21
-
22
-
23
-
24
-
25
-
26
-
27
-
28
-
29
-
30
-
31
-
32
-
33
-
34
-
35
-
36
-
37
-
38
-
39
-
40
-
41
-
42
-
43
-
44
-
45
-
46
-
47
-
48
-
49
-
50
-
51
-
52
-
53
-
54
-
55
-
56
-
57
-
58
-
59
-
60
-
61
-
62
-
63
-
64
-
65
-
66
-
67
-
68
-
69
-
70
-
 71
71 -
 72
72 -
 73
73 -
 74
74 -
 75
75 -
 76
76 -
 77
77 -
 78
78 -
 79
79 -
 80
80 -
 81
81 -
 82
82 -
 83
83 -
 84
84 -
 85
85 -
 86
86 -
 87
87 -
 88
88 -
 89
89 -
 90
90 -
 91
91 -
92
-
93
-
94
-
95
-
96
-
97
-
98
-
99
-
100
-
101
-
102
-
103
-
104
-
105
-
106
-
107
-
108
-
109
-
110
-
111
-
112
-
113
-
114
-
115
-
116
-
117
-
118
-
119
-
120
-
121
-
122
-
123
-
124
-
125
-
126
-
127
-
128
-
129
-
130
-
131
-
132
-
133
-
134
-
135
-
136
-
137
-
138
-
139
-
140
-
141
-
142
-
143
-
144
-
145
-
146
-
147
-
148
-
149
-
150
-
151
-
152
-
153
-
154
-
155
-
156
-
157
-
158
-
159
-
160
-
161
-
162
-
163
-
164
-
165
-
166
-
167
-
168
-
169
-
170
-
171
-
172
-
173
-
174
-
175
-
176
-
177
-
178
-
179
-
180
-
181
-
182
-
183
-
184
-
185
-
186
-
187
-
188
-
189
-
190
-
191
-
192
-
193
-
194
-
195
-
196
-
197
-
198
-
199
-
200
-
201
-
202
-
203
-
204
-
205
-
206
-
207
-
208
-
209
-
210
-
211
-
212
-
213
-
214
-
215
-
216
-
217
-
218
-
219
-
220
-
221
-
222
-
223
-
224
-
225
-
226
-
227
-
228
-
229
-
230
-
231
-
232
-
233
-
234
-
235
-
236
-
237
-
238
-
239
-
240
-
241
-
242
-
243
-
244
-
245
-
246
-
247
-
248
-
249
-
250
-
251
-
252
-
253
-
254
-
255
-
256
-
257
-
258
-
259
-
260
-
261
-
262
-
263
-
264
-
265
-
266
-
267
-
268
-
269
-
270
-
271
-
272
-
273
-
274
-
275
 |
 |

PART II
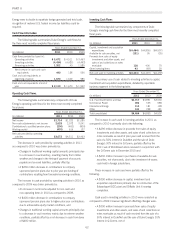
Duke Energy’s projected capital and investment expenditures for
the next three fiscal years are included in the table below.
(in millions) 2012 2013 2014
U.S. Franchised Electric and Gas $3,400 $3,200 $3,525
Commercial Power, International
Energy and Other 900 350 325
Total committed expenditures 4,300 3,550 3,850
Discretionary expenditures 200 400 650
Total projected capital and investment
expenditures $4,500 $3,950 $4,500
Duke Energy continues to focus on reducing risk and positioning
its business for future success and will invest principally in its
strongest business sectors. Based on this goal, the majority of Duke
Energy’s total projected capital expenditures are allocated to the U.S.
Franchised Electric and Gas segment. The table below includes the
components of projected capital expenditures for U.S. Franchised
Electric and Gas for the next three fiscal years.
2012 2013 2014
System growth 30% 21% 26%
Maintenance and upgrades of existing
facilities 55% 54% 47%
Nuclear fuel 9% 12% 11%
Environmental 6% 13% 16%
Total projected U.S. Franchised Electric and
Gas capital expenditures 100% 100% 100%
With respect to the 2012 capital expenditure plan, Duke Energy
has flexibility within its $4.5 billion budget to defer or eliminate
certain spending should economic or financing conditions deteriorate.
Of the $4.5 billion budget, $1.6 billion relates to projects for which
management has committed capital, including, but not limited to, the
continued construction of Cliffside Unit 6, the Edwardsport IGCC
plant and the Dan River combined cycle gas-fired facilities, and
management intends to spend those capital dollars in 2012
irrespective of broader economic factors. $2.7 billion of projected
2012 capital expenditures are expected to be used primarily for
overall system maintenance and upgrades, customer connections,
compliance with new environmental requirements and corporate
capital expenditures. Although these expenditures are ultimately
necessary to ensure overall system maintenance and reliability, the
timing of the expenditures may be influenced by broad economic
conditions and customer growth, thus management has more
flexibility in terms of when these dollars are actually spent. The
remaining planned 2012 capital expenditures of $0.2 billion are of a
discretionary nature and relate to growth opportunities in which Duke
Energy may invest, provided there are opportunities that meet return
expectations.
As a result of Duke Energy’s significant commitment to
modernize its generating fleet through the construction of new units,
the ability to cost effectively manage the construction phase of current
and future projects is critical to ensuring full and timely recovery of
costs of construction. Should Duke Energy encounter significant cost
overruns above amounts approved by the various state commissions,
and those amounts are disallowed for recovery in rates, or if
construction cost of renewable generation exceed amounts provided
through power sales agreements, future cash flows and results of
operations could be adversely impacted.
Many of Duke Energy’s current capital expenditure projects,
including system modernization and renewable investments, qualify
for bonus depreciation. Duke Energy estimates that over time it could
generate cumulative cash benefits of approximately $2.3 billion for
projects expected to be placed in service by the end of 2012. Even
though bonus depreciation related to Duke Energy’s regulated projects
reduces rate base eligible for inclusion in future rates, the cash
benefits will decrease Duke Energy’s need for financings over time
and help to mitigate future customer rate increases.
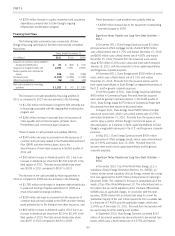
Duke Energy’s capitalization is balanced between debt and
equity as shown in the table below.
Projected
2012 2011 2010
Equity 52% 52% 55%
Debt 48% 48% 45%
Duke Energy’s fixed charges coverage ratio, calculated using
SEC guidelines, was 3.2 times for 2011, 3.0 times for 2010, and
3.0 times for 2009.
In 2012, Duke Energy currently anticipates issuing additional
net debt of $400 million, primarily for the purpose of funding capital
expenditures. Due to the flexibility in the timing of projected 2012
capital expenditures, the timing and amount of debt issuances
throughout 2012 could be influenced by changes in capital
spending.
In November 2011, Duke Energy entered into a new $6 billion,
five-year master credit facility with $4.0 billion available at closing
and the remaining $2.0 billion available following successful
completion of the proposed merger with Progress Energy, Inc. This
facility is not restricted upon general market conditions. Additionally,
Duke Energy has access to $0.2 billion in a credit facility from
smaller regional banks. At December 31, 2011, Duke Energy has
available borrowing capacity of $3.3 billion under these facilities.
Management currently believes that amounts available under its
revolving credit facilities are accessible should there be a need to
generate additional short-term financing in 2012. Management
expects that cash flows from operations and issuances of debt will be
sufficient to cover the 2012 funding requirements related to capital
and investments expenditures, dividend payments and debt
maturities. See “Credit Facilities” section below for additional
information regarding Duke Energy’s credit facilities.
Duke Energy monitors compliance with all debt covenants and
restrictions and does not currently believe it will be in violation or
breach of its significant debt covenants during 2012. However,
circumstances could arise that may alter that view. If and when
management had a belief that such potential breach could exist,
appropriate action would be taken to mitigate any such issue. Duke
Energy also maintains an active dialogue with the credit rating
agencies.
Duke Energy periodically evaluates the impact of repatriation of
cash generated and held in foreign countries. Duke Energy’s current
intent is to indefinitely reinvest foreign earnings. However,
circumstances could arise that may alter that view, including a future
change in tax law governing U.S. taxation of foreign earnings. If Duke
61