Duke Energy 2011 Annual Report Download - page 89
Download and view the complete annual report
Please find page 89 of the 2011 Duke Energy annual report below. You can navigate through the pages in the report by either clicking on the pages listed below, or by using the keyword search tool below to find specific information within the annual report.-
 1
1 -
2
-
3
-
4
-
5
-
6
-
7
-
8
-
9
-
10
-
11
-
12
-
13
-
14
-
15
-
16
-
17
-
18
-
19
-
20
-
21
-
22
-
23
-
24
-
25
-
26
-
27
-
28
-
29
-
30
-
31
-
32
-
33
-
34
-
35
-
36
-
37
-
38
-
39
-
40
-
41
-
42
-
43
-
44
-
45
-
46
-
47
-
48
-
49
-
50
-
51
-
52
-
53
-
54
-
55
-
56
-
57
-
58
-
59
-
60
-
61
-
62
-
63
-
64
-
65
-
66
-
67
-
68
-
69
-
70
-
71
-
72
-
73
-
74
-
75
-
76
-
77
-
78
-
 79
79 -
 80
80 -
 81
81 -
 82
82 -
 83
83 -
 84
84 -
 85
85 -
 86
86 -
 87
87 -
 88
88 -
 89
89 -
 90
90 -
 91
91 -
 92
92 -
 93
93 -
 94
94 -
 95
95 -
 96
96 -
 97
97 -
 98
98 -
 99
99 -
100
-
101
-
102
-
103
-
104
-
105
-
106
-
107
-
108
-
109
-
110
-
111
-
112
-
113
-
114
-
115
-
116
-
117
-
118
-
119
-
120
-
121
-
122
-
123
-
124
-
125
-
126
-
127
-
128
-
129
-
130
-
131
-
132
-
133
-
134
-
135
-
136
-
137
-
138
-
139
-
140
-
141
-
142
-
143
-
144
-
145
-
146
-
147
-
148
-
149
-
150
-
151
-
152
-
153
-
154
-
155
-
156
-
157
-
158
-
159
-
160
-
161
-
162
-
163
-
164
-
165
-
166
-
167
-
168
-
169
-
170
-
171
-
172
-
173
-
174
-
175
-
176
-
177
-
178
-
179
-
180
-
181
-
182
-
183
-
184
-
185
-
186
-
187
-
188
-
189
-
190
-
191
-
192
-
193
-
194
-
195
-
196
-
197
-
198
-
199
-
200
-
201
-
202
-
203
-
204
-
205
-
206
-
207
-
208
-
209
-
210
-
211
-
212
-
213
-
214
-
215
-
216
-
217
-
218
-
219
-
220
-
221
-
222
-
223
-
224
-
225
-
226
-
227
-
228
-
229
-
230
-
231
-
232
-
233
-
234
-
235
-
236
-
237
-
238
-
239
-
240
-
241
-
242
-
243
-
244
-
245
-
246
-
247
-
248
-
249
-
250
-
251
-
252
-
253
-
254
-
255
-
256
-
257
-
258
-
259
-
260
-
261
-
262
-
263
-
264
-
265
-
266
-
267
-
268
-
269
-
270
-
271
-
272
-
273
-
274
-
275
 |
 |

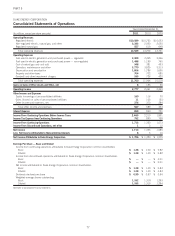
PART II
Generation Portfolio Risks.
TheDukeEnergyRegistrantsareprimarilyexposedtomarket
price fluctuations of wholesale power, natural gas, and coal prices in
the U.S. Franchised Electric and Gas and Commercial Power
segments. The Duke Energy Registrants optimize the value of their
wholesale and non-regulated generation portfolios. The portfolios
include generation assets (power and capacity), fuel, and emission
allowances. Modeled forecasts of future generation output, fuel
requirements, and emission allowance requirements are based on
forward power, fuel and emission allowance markets. The
component pieces of the portfolio are bought and sold based on
models and forecasts of generation in order to manage the economic
value of the portfolio in accordance with the strategies of the business
units. For Duke Energy Carolinas and Duke Energy Indiana, as well
as the Kentucky regulated generation owned by Duke Energy Ohio,
the generation portfolio not utilized to serve retail operations or
committed load is subject to commodity price fluctuations, although
the impact on the Consolidated Statements of Operations is partially
offset by mechanisms in these regulated jurisdictions that result in the
sharing of net profits from these activities with retail customers. Duke
Energy Ohio is subject to wholesale commodity price risks for its
non-regulated coal-fired and gas-fired generation portfolio. The
non-regulated generation portfolio dispatches all of their electricity into
unregulated markets and receives wholesale energy margins and
capacity revenues from PJM. Duke Energy Ohio has fully hedged its
forecasted coal-fired generation for 2012. Capacity revenues are
100% contracted in PJM through May 2015. International Energy
generally hedges its expected generation using long-term bilateral
power sales contracts when favorable market conditions exist and it is
subject to wholesale commodity price risks for electricity not sold
under such contracts. International Energy dispatches electricity not
sold under long-term bilateral contracts into unregulated markets and
receives wholesale energy margins and capacity revenues from
national system operators. Derivative contracts executed to manage
generation portfolio risks for delivery periods beyond 2012 are also
exposed to changes in fair value due to market price fluctuations of
wholesale power and coal. See “Sensitivity Analysis for Generation
Portfolio and Derivative Price Risks” below, for more information
regarding the effect of changes in commodity prices on the Duke
Energy Registrants’ net income.
Other Commodity Risks.
At December 31, 2011, pre-tax income in 2012 was not
expected to be materially impacted for exposures to other
commodities’ price changes.
Sensitivity Analysis for Generation Portfolio and Derivative Price
Risks
The table below summarizes the estimated effect of commodity
price changes on the Duke Energy Registrants’ pre-tax net income,
based on a sensitivity analysis performed as of December 31, 2011
and December 31, 2010 for Duke Energy and Duke Energy Ohio.
Duke Energy Carolinas’ and Duke Energy Indiana’s forecasted exposure
to commodity price risk is not anticipated to have a material adverse
effect on its consolidated results of operations in 2012, based on a
sensitivity analysis performed as of December 31, 2011. The sensitivity
analysis performed as of December 31, 2010, related to forecasted
exposure to commodity price risk during 2011 also indicated that
commodity price risk would not have a material adverse effect on Duke
Energy Carolinas’ and Duke Energy Indiana’s consolidated results of
operations during 2011 and the impacts of changing commodity prices
in its consolidated results of operations for 2011 was insignificant. The
following commodity price sensitivity calculations consider existing
hedge positions and estimated production levels, as indicated in the
table below, but do not consider other potential effects that might result
from such changes in commodity prices.
Summary of Sensitivity Analysis for Generation Portfolio and Derivative Price Risks
($ in millions)
Generation Portfolio
Risks for 2012(a)
As of December 31,
Sensitivities for derivatives
beyond 2012(b)
As of December 31,
Potential effect on pre-tax net income
assuming a 10% price change in: 2011 2010 2011 2010
Duke Energy:
Forward wholesale power prices (per MWh) $71 $20 $24 $20
Forward coal prices (per ton) 22——
Gas prices (per MMBtu) 42 17 ——
Duke Energy Ohio:
Forward wholesale power prices (per MWh) $69 $19 $24 $20
Forward coal prices (per ton) 22——
Gas prices (per MMBtu) 42 17 ——
(a) Amounts related to forward wholesale prices represent the potential impact of commodity price changes on forecasted economic generation which has not been contracted or hedged.
Amounts related to forward coal prices and forward gas prices represent the potential impact of commodity price changes on fuel needed to achieve such economic generation. Amounts
exclude the impact of mark-to-market changes on undesignated contracts relating to periods in excess of one year from the respective date.
(b) Amounts represent sensitivities related to derivative contracts executed to manage generation portfolio risks for periods beyond 2012. Amounts exclude the potential impact of commodity
price changes on forecasted economic generation and fuel needed to achieve such forecasted generation.
69