Duke Energy 2011 Annual Report Download - page 193
Download and view the complete annual report
Please find page 193 of the 2011 Duke Energy annual report below. You can navigate through the pages in the report by either clicking on the pages listed below, or by using the keyword search tool below to find specific information within the annual report.-
 1
1 -
2
-
3
-
4
-
5
-
6
-
7
-
8
-
9
-
10
-
11
-
12
-
13
-
14
-
15
-
16
-
17
-
18
-
19
-
20
-
21
-
22
-
23
-
24
-
25
-
26
-
27
-
28
-
29
-
30
-
31
-
32
-
33
-
34
-
35
-
36
-
37
-
38
-
39
-
40
-
41
-
42
-
43
-
44
-
45
-
46
-
47
-
48
-
49
-
50
-
51
-
52
-
53
-
54
-
55
-
56
-
57
-
58
-
59
-
60
-
61
-
62
-
63
-
64
-
65
-
66
-
67
-
68
-
69
-
70
-
71
-
72
-
73
-
74
-
75
-
76
-
77
-
78
-
79
-
80
-
81
-
82
-
83
-
84
-
85
-
86
-
87
-
88
-
89
-
90
-
91
-
92
-
93
-
94
-
95
-
96
-
97
-
98
-
99
-
100
-
101
-
102
-
103
-
104
-
105
-
106
-
107
-
108
-
109
-
110
-
111
-
112
-
113
-
114
-
115
-
116
-
117
-
118
-
119
-
120
-
121
-
122
-
123
-
124
-
125
-
126
-
127
-
128
-
129
-
130
-
131
-
132
-
133
-
134
-
135
-
136
-
137
-
138
-
139
-
140
-
141
-
142
-
143
-
144
-
145
-
146
-
147
-
148
-
149
-
150
-
151
-
152
-
153
-
154
-
155
-
156
-
157
-
158
-
159
-
160
-
161
-
162
-
163
-
164
-
165
-
166
-
167
-
168
-
169
-
170
-
171
-
172
-
173
-
174
-
175
-
176
-
177
-
178
-
179
-
180
-
181
-
182
-
 183
183 -
 184
184 -
 185
185 -
 186
186 -
 187
187 -
 188
188 -
 189
189 -
 190
190 -
 191
191 -
 192
192 -
 193
193 -
 194
194 -
 195
195 -
 196
196 -
 197
197 -
 198
198 -
 199
199 -
 200
200 -
 201
201 -
 202
202 -
 203
203 -
204
-
205
-
206
-
207
-
208
-
209
-
210
-
211
-
212
-
213
-
214
-
215
-
216
-
217
-
218
-
219
-
220
-
221
-
222
-
223
-
224
-
225
-
226
-
227
-
228
-
229
-
230
-
231
-
232
-
233
-
234
-
235
-
236
-
237
-
238
-
239
-
240
-
241
-
242
-
243
-
244
-
245
-
246
-
247
-
248
-
249
-
250
-
251
-
252
-
253
-
254
-
255
-
256
-
257
-
258
-
259
-
260
-
261
-
262
-
263
-
264
-
265
-
266
-
267
-
268
-
269
-
270
-
271
-
272
-
273
-
274
-
275
 |
 |

PART II
DUKE ENERGY CORPORATION •DUKE ENERGY CAROLINAS, LLC •DUKE ENERGY OHIO, INC. •DUKE ENERGY INDIANA, INC.
Combined Notes to Consolidated Financial Statements – (Continued)
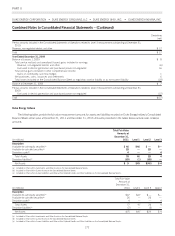
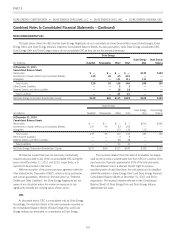
Rollforward of Level 3 measurements
(in millions)
Derivatives
(net)
Year Ended December 31, 2011
Balance at January 1, 2011 $4
Total pre-tax realized or unrealized gains included in earnings:
Revenue, regulated electric(a) 14
Net purchases, sales, issuances and settlements:
Purchases(a) 8
Settlements (21)
Total losses included on the Consolidated Balance Sheet as regulatory asset or liability or as current or non-current liability (1)
Balance at December 31, 2011 $4
(a) Amounts relate to financial transmission rights.
Year Ended December 31, 2010
Balance at January 1, 2010 $4
Net purchases, sales, issuances and settlements (15)
Total gains included on the Consolidated Balance Sheet as regulatory asset or liability or as current or non-current liability 15
Balance at December 31, 2010 $4
Year Ended December 31, 2009
Balance at January 1, 2009 $10
Net purchases, sales, issuances and settlements (9)
Total gains included on the Consolidated Balance Sheet as regulatory asset or liability or as current or non-current liability 3
Balance at December 31, 2009 $4
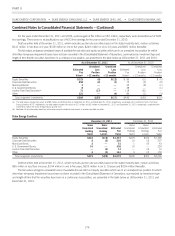
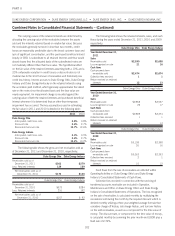
Additional Fair Value Disclosures — Long-term debt:
The fair value of financial instruments, excluding financial assets and certain financial liabilities included in the scope of the accounting
guidance for fair value measurements disclosed in the tables above, is summarized in the following table. Judgment is required in interpreting
market data to develop the estimates of fair value. Accordingly, the estimates determined as of December 31, 2011 and 2010 are not
necessarily indicative of the amounts the Duke Energy Registrants could have settled in current markets.
As of December 31, 2011
Duke Energy
Duke Energy
Carolinas Duke Energy Ohio Duke Energy Indiana
(in millions)
Book
Value(a)
Approximate
Fair Value
Book
Value(a)
Approximate
Fair Value
Book
Value
Approximate
Fair Value
Book
Value
Approximate
Fair Value
Long-term debt, including current
maturities $20,573 $23,053 $9,274 $10,629 $2,555 $2,688 $3,459 $4,048
(a) Includes Non-recourse long-term debt of variable interest entities of $949 million for Duke Energy and $300 million for Duke Energy Carolinas.
As of December 31, 2010
Duke Energy
Duke Energy
Carolinas Duke Energy Ohio Duke Energy Indiana
(in millions)
Book
Value
Approximate
Fair Value
Book
Value
Approximate
Fair Value
Book
Value
Approximate
Fair Value
Book
Value
Approximate
Fair Value
Long-term debt, including current
maturities(a) $18,210 $19,484 $7,770 $8,376 $2,564 $2,614 $3,472 $3,746
a) Includes Non-recourse long-term debt of variable interest entities of $976 million for Duke Energy and $300 million for Duke Energy Carolinas.
173