Duke Energy 2011 Annual Report Download - page 67
Download and view the complete annual report
Please find page 67 of the 2011 Duke Energy annual report below. You can navigate through the pages in the report by either clicking on the pages listed below, or by using the keyword search tool below to find specific information within the annual report.-
 1
1 -
2
-
3
-
4
-
5
-
6
-
7
-
8
-
9
-
10
-
11
-
12
-
13
-
14
-
15
-
16
-
17
-
18
-
19
-
20
-
21
-
22
-
23
-
24
-
25
-
26
-
27
-
28
-
29
-
30
-
31
-
32
-
33
-
34
-
35
-
36
-
37
-
38
-
39
-
40
-
41
-
42
-
43
-
44
-
45
-
46
-
47
-
48
-
49
-
50
-
51
-
52
-
53
-
54
-
55
-
56
-
 57
57 -
 58
58 -
 59
59 -
 60
60 -
 61
61 -
 62
62 -
 63
63 -
 64
64 -
 65
65 -
 66
66 -
 67
67 -
 68
68 -
 69
69 -
 70
70 -
 71
71 -
 72
72 -
 73
73 -
 74
74 -
 75
75 -
 76
76 -
 77
77 -
78
-
79
-
80
-
81
-
82
-
83
-
84
-
85
-
86
-
87
-
88
-
89
-
90
-
91
-
92
-
93
-
94
-
95
-
96
-
97
-
98
-
99
-
100
-
101
-
102
-
103
-
104
-
105
-
106
-
107
-
108
-
109
-
110
-
111
-
112
-
113
-
114
-
115
-
116
-
117
-
118
-
119
-
120
-
121
-
122
-
123
-
124
-
125
-
126
-
127
-
128
-
129
-
130
-
131
-
132
-
133
-
134
-
135
-
136
-
137
-
138
-
139
-
140
-
141
-
142
-
143
-
144
-
145
-
146
-
147
-
148
-
149
-
150
-
151
-
152
-
153
-
154
-
155
-
156
-
157
-
158
-
159
-
160
-
161
-
162
-
163
-
164
-
165
-
166
-
167
-
168
-
169
-
170
-
171
-
172
-
173
-
174
-
175
-
176
-
177
-
178
-
179
-
180
-
181
-
182
-
183
-
184
-
185
-
186
-
187
-
188
-
189
-
190
-
191
-
192
-
193
-
194
-
195
-
196
-
197
-
198
-
199
-
200
-
201
-
202
-
203
-
204
-
205
-
206
-
207
-
208
-
209
-
210
-
211
-
212
-
213
-
214
-
215
-
216
-
217
-
218
-
219
-
220
-
221
-
222
-
223
-
224
-
225
-
226
-
227
-
228
-
229
-
230
-
231
-
232
-
233
-
234
-
235
-
236
-
237
-
238
-
239
-
240
-
241
-
242
-
243
-
244
-
245
-
246
-
247
-
248
-
249
-
250
-
251
-
252
-
253
-
254
-
255
-
256
-
257
-
258
-
259
-
260
-
261
-
262
-
263
-
264
-
265
-
266
-
267
-
268
-
269
-
270
-
271
-
272
-
273
-
274
-
275
 |
 |

PART II
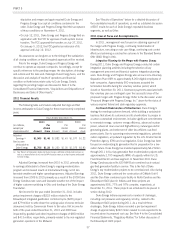
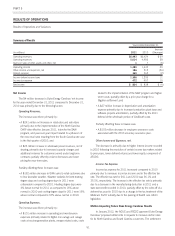
Operating Expenses.
The decrease was primarily driven by:
• A $584 million decrease in impairment charges primarily
related to a $660 million charge related to goodwill and
non-regulated coal-fired generation asset impairments in the
Midwest in 2010, as compared to a $79 million impairment
in 2011 to write down the carrying value of excess emission
allowances held to fair value as a result of the EPA’s issuance
of the Cross-State Air Pollution Rule (CSAPR) and a $9 million
impairment of the Vermillion generation station in 2011. See
Note 12 to the Consolidated Financial Statements, “Goodwill,
Intangible Assets and Impairments,” for additional information;
and
• A $65 million decrease in retail fuel and purchased power
expenses due to lower generation volumes net of higher
purchased power volumes in 2011 as compared to 2010.
Partially offsetting these decreases were:
• A $156 million increase in wholesale fuel expenses due to
higher generation volumes, partially offset by favorable hedge
realizations in 2011 as compared to 2010;
• A $68 million increase in operating expenses resulting
primarily from the recognition of Midwest ISO exit fees, higher
maintenance expenses and higher transmission costs in 2011
compared to 2010; and
• A $30 million increase in mark-to-market fuel expense on
non-qualifying fuel hedge contracts, consisting of
mark-to-market losses of $3 million in 2011 compared to
gains of $27 million in 2010.
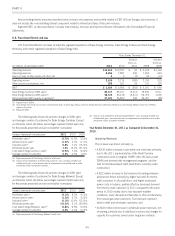
Gains on Sales of Other Assets and Other, net.
The increase in 2011 as compared to 2010 is attributable to
2011 gains on sales of certain assets resulting from a contract
termination.
Other Income and Expenses, net.
The decrease in 2011 as compared to 2010 is primarily due to
distributions from South Houston Green Power received in 2010
which did not recur in 2011.
EBIT.
The increase is primarily attributable to lower goodwill,
generation and other asset impairment charges, higher wholesale
margins due to increased generation volumes, and an increase in
renewables generation revenues. These factors were partially offset by
lower retail margins driven by customer switching and unfavorable
weather, higher operating expenses resulting from the recognition of
Midwest ISO exit fees and increased maintenance expenses, and net
mark-to-market losses on non-qualifying commodity hedge contracts
in 2011 compared to gains in 2010.
Matters Impacting Future Commercial Power Results
Commercial Power’s coal-fired generation assets were dedicated
under Duke Energy Ohio’s ESP through December 31, 2011. The
PUCO approved Duke Energy Ohio’s new ESP in November 2011.
The new ESP effectively separates the generation of electricity from
Duke Energy Ohio’s retail load obligation as of January 1, 2012. As a
result, Commercial Power’s coal-fired generation assets no longer
serve retail load customers or receive negotiated pricing under the
ESP. The coal-fired generation assets began dispatching all of their
electricity into unregulated markets in January 2012 and going
forward will receive wholesale energy margins and capacity revenues
from PJM at rates currently below those previously collected under
the prior ESP. The impact of these lower energy margins and capacity
revenues are expected to be partially offset by a non-bypassable
stability charge collected from Duke Energy Ohio’s retail customers
through 2014. As a result, Commercial Power’s operating revenues
and EBIT will be negatively impacted.
Commercial Power’s gas-fired non-regulated generation assets
earn capacity revenues from PJM. PJM capacity prices are
determined through an auction process for planning years from June
through May of the following year and are conducted approximately
three years in advance of the capacity delivery period. Capacity
prices, for periods beginning June 2011 and continuing through May
2014 will be significantly lower than current and historical capacity
prices. As a result, Commercial Power’s operating revenues and EBIT
will be negatively impacted through 2014.
Commercial Power is focused on growing its non-regulated
renewable energy portfolio. Results for Commercial Power are
dependent upon completion of renewable energy construction
projects and tax credits from renewable energy production and project
investments. Failure of current construction projects to reach
commercial operation before the expiration of certain tax credits at the
end of 2011 could have a significant impact on Commercial Power’s
results of operations.
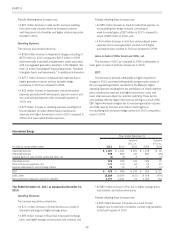
Year Ended December 31, 2010 as compared to December 31,
2009
Operating Revenues.
The increase was primarily driven by:
• A $294 million increase in wholesale electric revenues due to
higher generation volumes and pricing net of lower margin
earned from participation in wholesale auctions;
• A $54 million increase in PJM capacity revenues due to
additional megawatts participating in the auction and higher
cleared auction pricing in 2010 compared to 2009;
• A $51 million increase in renewable generation revenues due
to additional wind generation facilities placed in service in
2010 and a full year of operations for wind generation
facilities placed in service throughout 2009; and
• An $8 million increase in net mark-to-market revenues on
non-qualifying power and capacity hedge contracts, consisting
of mark-to-market gains of $6 million in 2010 compared to
losses of $2 million in 2009.
47