Duke Energy 2011 Annual Report Download - page 71
Download and view the complete annual report
Please find page 71 of the 2011 Duke Energy annual report below. You can navigate through the pages in the report by either clicking on the pages listed below, or by using the keyword search tool below to find specific information within the annual report.-
 1
1 -
2
-
3
-
4
-
5
-
6
-
7
-
8
-
9
-
10
-
11
-
12
-
13
-
14
-
15
-
16
-
17
-
18
-
19
-
20
-
21
-
22
-
23
-
24
-
25
-
26
-
27
-
28
-
29
-
30
-
31
-
32
-
33
-
34
-
35
-
36
-
37
-
38
-
39
-
40
-
41
-
42
-
43
-
44
-
45
-
46
-
47
-
48
-
49
-
50
-
51
-
52
-
53
-
54
-
55
-
56
-
57
-
58
-
59
-
60
-
 61
61 -
 62
62 -
 63
63 -
 64
64 -
 65
65 -
 66
66 -
 67
67 -
 68
68 -
 69
69 -
 70
70 -
 71
71 -
 72
72 -
 73
73 -
 74
74 -
 75
75 -
 76
76 -
 77
77 -
 78
78 -
 79
79 -
 80
80 -
 81
81 -
82
-
83
-
84
-
85
-
86
-
87
-
88
-
89
-
90
-
91
-
92
-
93
-
94
-
95
-
96
-
97
-
98
-
99
-
100
-
101
-
102
-
103
-
104
-
105
-
106
-
107
-
108
-
109
-
110
-
111
-
112
-
113
-
114
-
115
-
116
-
117
-
118
-
119
-
120
-
121
-
122
-
123
-
124
-
125
-
126
-
127
-
128
-
129
-
130
-
131
-
132
-
133
-
134
-
135
-
136
-
137
-
138
-
139
-
140
-
141
-
142
-
143
-
144
-
145
-
146
-
147
-
148
-
149
-
150
-
151
-
152
-
153
-
154
-
155
-
156
-
157
-
158
-
159
-
160
-
161
-
162
-
163
-
164
-
165
-
166
-
167
-
168
-
169
-
170
-
171
-
172
-
173
-
174
-
175
-
176
-
177
-
178
-
179
-
180
-
181
-
182
-
183
-
184
-
185
-
186
-
187
-
188
-
189
-
190
-
191
-
192
-
193
-
194
-
195
-
196
-
197
-
198
-
199
-
200
-
201
-
202
-
203
-
204
-
205
-
206
-
207
-
208
-
209
-
210
-
211
-
212
-
213
-
214
-
215
-
216
-
217
-
218
-
219
-
220
-
221
-
222
-
223
-
224
-
225
-
226
-
227
-
228
-
229
-
230
-
231
-
232
-
233
-
234
-
235
-
236
-
237
-
238
-
239
-
240
-
241
-
242
-
243
-
244
-
245
-
246
-
247
-
248
-
249
-
250
-
251
-
252
-
253
-
254
-
255
-
256
-
257
-
258
-
259
-
260
-
261
-
262
-
263
-
264
-
265
-
266
-
267
-
268
-
269
-
270
-
271
-
272
-
273
-
274
-
275
 |
 |

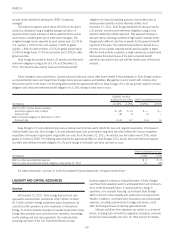
PART II
RESULTS OF OPERATIONS
Results of Operations and Variances
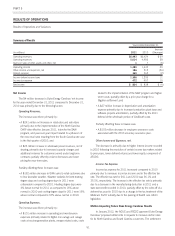
Summary of Results
Years Ended December 31,
(in millions) 2011 2010
Increase
(Decrease)
Operating revenues $6,493 $6,424 $ 69
Operating expenses 5,014 4,986 28
Gains on sales of other assets and other, net 17(6)
Operating income 1,480 1,445 35
Other income and expenses, net 186 212 (26)
Interest expense 360 362 (2)
Income before income taxes 1,306 1,295 11
Income tax expense 472 457 15
Net income $ 834 $ 838 $ (4)
Net Income
The $4 million decrease in Duke Energy Carolinas’ net income
for the year ended December 31, 2011 compared to December 31,
2010 was primarily due to the following factors:
Operating Revenues.
The increase was driven primarily by:
• A $241 million net increase in retail rates and rate riders
primarily due to the implementation of the North Carolina
CWIP rider effective January 2011, riders for the SAW
program, and year-over-year impact related to a phase-in of
the new retail rates resulting from the South Carolina rate case
in the first quarter of 2010; and
• A $23 million increase in wholesale power revenues, net of
sharing, primarily due to increased capacity charges and
additional volumes for customers served under long-term
contracts; partially offset by volume decreases and lower
pricing for near-term sales.
Partially offsetting these increases was:
• A $192 million decrease in GWh sales to retail customers due
to less favorable weather. Weather statistics for both heating
degree days and cooling degree days in 2011 were
unfavorable compared to 2010. Heating degree days were
4% below normal for 2011 as compared to 16% above
normal in 2010 and cooling degree days for 2011 were 19%
above normal compared to 33% above normal in 2010.
Operating Expenses.
The increase was driven primarily by:
• A $101 million increase in operating and maintenance
expenses primarily related to higher non-outage and outage
costs at nuclear generation plants, merger related costs, costs
related to the implementation of the SAW program and higher
storm costs; partially offset by a prior year charge for a
litigation settlement; and
• A $27 million increase in depreciation and amortization
expense primarily due to increased production plant base and
software projects amortization; partially offset by the 2011
deferral of the wholesale portion of GridSouth costs.
Partially offsetting these increases was:
• A $103 million decrease in employee severance costs
associated with the 2010 voluntary severance plan.
Other Income and Expenses, net.
The decrease is primarily due to higher interest income recorded
in 2010 following the resolution of certain income tax matters related
to prior years, lower deferred returns and lower equity component of
AFUDC.
Income Tax Expense.
Income tax expense for 2011 increased compared to 2010
primarily due to increases in pre-tax income and in the effective tax
rate. The effective tax rate for 2011 and 2010 was 36.1% and
35.3%, respectively. The increase in the effective tax rate is primarily
due to a decrease in the manufacturing deduction in 2011 and a
state tax benefit recorded in 2010, partially offset by the write-off of a
deferred tax asset in 2010 due to a change in the tax treatment of the
Medicare Part D subsidy due to the passing of health care reform
legislation.
Matters Impacting Future Duke Energy Carolinas Results
In January 2012, the NCUC and PSCSC approved Duke Energy
Carolinas’ proposed settlements in requests to increase electric rates
for its North Carolina and South Carolina customers. The settlement
51