Duke Energy 2011 Annual Report Download - page 31
Download and view the complete annual report
Please find page 31 of the 2011 Duke Energy annual report below. You can navigate through the pages in the report by either clicking on the pages listed below, or by using the keyword search tool below to find specific information within the annual report.-
 1
1 -
2
-
3
-
4
-
5
-
6
-
7
-
8
-
9
-
10
-
11
-
12
-
13
-
14
-
15
-
16
-
17
-
18
-
19
-
20
-
 21
21 -
 22
22 -
 23
23 -
 24
24 -
 25
25 -
 26
26 -
 27
27 -
 28
28 -
 29
29 -
 30
30 -
 31
31 -
 32
32 -
 33
33 -
 34
34 -
 35
35 -
 36
36 -
 37
37 -
 38
38 -
 39
39 -
 40
40 -
 41
41 -
42
-
43
-
44
-
45
-
46
-
47
-
48
-
49
-
50
-
51
-
52
-
53
-
54
-
55
-
56
-
57
-
58
-
59
-
60
-
61
-
62
-
63
-
64
-
65
-
66
-
67
-
68
-
69
-
70
-
71
-
72
-
73
-
74
-
75
-
76
-
77
-
78
-
79
-
80
-
81
-
82
-
83
-
84
-
85
-
86
-
87
-
88
-
89
-
90
-
91
-
92
-
93
-
94
-
95
-
96
-
97
-
98
-
99
-
100
-
101
-
102
-
103
-
104
-
105
-
106
-
107
-
108
-
109
-
110
-
111
-
112
-
113
-
114
-
115
-
116
-
117
-
118
-
119
-
120
-
121
-
122
-
123
-
124
-
125
-
126
-
127
-
128
-
129
-
130
-
131
-
132
-
133
-
134
-
135
-
136
-
137
-
138
-
139
-
140
-
141
-
142
-
143
-
144
-
145
-
146
-
147
-
148
-
149
-
150
-
151
-
152
-
153
-
154
-
155
-
156
-
157
-
158
-
159
-
160
-
161
-
162
-
163
-
164
-
165
-
166
-
167
-
168
-
169
-
170
-
171
-
172
-
173
-
174
-
175
-
176
-
177
-
178
-
179
-
180
-
181
-
182
-
183
-
184
-
185
-
186
-
187
-
188
-
189
-
190
-
191
-
192
-
193
-
194
-
195
-
196
-
197
-
198
-
199
-
200
-
201
-
202
-
203
-
204
-
205
-
206
-
207
-
208
-
209
-
210
-
211
-
212
-
213
-
214
-
215
-
216
-
217
-
218
-
219
-
220
-
221
-
222
-
223
-
224
-
225
-
226
-
227
-
228
-
229
-
230
-
231
-
232
-
233
-
234
-
235
-
236
-
237
-
238
-
239
-
240
-
241
-
242
-
243
-
244
-
245
-
246
-
247
-
248
-
249
-
250
-
251
-
252
-
253
-
254
-
255
-
256
-
257
-
258
-
259
-
260
-
261
-
262
-
263
-
264
-
265
-
266
-
267
-
268
-
269
-
270
-
271
-
272
-
273
-
274
-
275
 |
 |

PART I
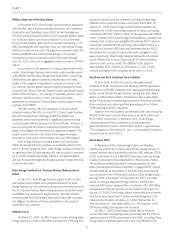
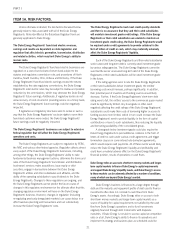
Fuel Supply
USFE&G relies principally on coal and nuclear fuel for its generation of electric energy. The following table lists USFE&G’s sources of power
and fuel costs for the three years ended December 31, 2011.
Generation by Source
(Percent)
Cost of Delivered Fuel per Net
Kilowatt-hour Generated (Cents)
2011(d) 2010(d) 2009 2011(d) 2010(d) 2009
Coal(a) 60.0 61.5 59.6 3.17 3.04 2.88
Nuclear 37.6 36.3 38.5 0.55 0.52 0.48
Oil and gas(b) 1.4 0.9 0.4 5.89 6.77 7.71
All fuels (cost-based on weighted average)(a) 99.0 98.7 98.5 2.21 2.15 1.96
Hydroelectric(c) 1.0 1.3 1.5
100.0 100.0 100.0
(a) Statistics related to coal generation and all fuels reflect USFE&G’s 69% ownership interest in the East Bend Steam Station and 50.05% ownership interest in Unit 5 of the Gibson Steam
Station.
(b) Cost statistics include amounts for light-off fuel at USFE&G’s coal-fired stations and combined cycle (gas only).
(c) Generating figures are net of output required to replenish pumped storage facilities during off-peak periods.
(d) In addition, Duke Energy Carolinas produced approximately 6,000 megawatt-hours (MWh) in solar generation for 2011 and 2010; no fuel costs are attributed to this generation.
Coal.
USFE&G meets its coal demand in the Carolinas and Midwest
through a portfolio of long-term purchase contracts and short-term
spot market purchase agreements. Large amounts of coal are
purchased under long-term contracts with mining operators who
mine both underground and at the surface. USFE&G uses spot-
market purchases to meet coal requirements not met by long-term
contracts. Expiration dates for its long-term contracts, which have
various price adjustment provisions and market re-openers, range
from 2012 to 2014 for the Carolinas and 2012 to 2016 for the
Midwest. USFE&G expects to renew these contracts or enter into
similar contracts with other suppliers for the quantities and quality of
coal required as existing contracts expire, though prices will fluctuate
over time as coal markets change. The coal purchased for the
Carolinas is primarily produced from mines in eastern Kentucky,
West Virginia and southwestern Virginia. The coal purchased for the
regulated Midwest entities is primarily produced in Indiana, Illinois,
and Kentucky. USFE&G has an adequate supply of coal under
contract to fuel its projected 2012 operations and a significant portion
of supply to fuel its projected 2013 operations. Coal inventory levels
have increased during the past year due to the impact of mild
weather and the economy on retail load and low natural gas prices
which are resulting in higher combined cycle gas-fired generation. If
these factors continue for an extended period of time, USFE&G could
have excess levels of coal inventory or incur incremental purchased
powerorothercosts.
The current average sulfur content of coal purchased by
USFE&G for the Carolinas is between 1% and 2%; while the
Midwest is between 2% and 3%. USFE&G’s scrubbers, in
combination with the use of sulfur dioxide (SO2) emission
allowances, enable USFE&G to satisfy current SO2emission
limitations for existing facilities in the Carolinas and Midwest.
Gas.
USFE&Gisresponsibleforthepurchaseandthesubsequent
delivery of natural gas to native load customers in its Ohio and
Kentucky service territories. USFE&G’s natural gas procurement
strategy is to buy firm natural gas supplies (natural gas intended to be
available at all times) and firm interstate pipeline transportation
capacity during the winter season (November through March) and
during the non-heating season (April through October) through a
combination of firm supply and transportation capacity along with
spot supply and interruptible transportation capacity. This strategy
allows USFE&G to assure reliable natural gas supply for its high
priority (non-curtailable) firm customers during peak winter conditions
and provides USFE&G the flexibility to reduce its contract
commitments if firm customers choose alternate gas suppliers under
USFE&G customer choice/gas transportation programs. In 2011, firm
supply purchase commitment agreements provided approximately
100% of the natural gas supply. These firm supply agreements
feature two levels of gas supply, specifically (i.) base load, which is a
continuous supply to meet normal demand requirements, and (ii.)
swing load, which is gas available on a daily basis to accommodate
changes in demand due primarily to changing weather conditions.
USFE&G also owns two underground caverns with a total
storage capacity of 16 million gallons of liquid propane. In addition,
USFE&G has access to 5.5 million gallons of liquid propane storage
and product loan through a commercial services agreement with a
third party. This liquid propane is used in the three propane/air peak
shaving plants located in Ohio and Kentucky. Propane/air peak
shaving plants vaporize the propane and mix it with natural gas to
supplement the natural gas supply during peak demand periods.
USFE&G maintains natural gas procurement-price volatility
mitigation programs for Duke Energy Ohio and Duke Energy
Kentucky. These programs pre-arrange percentages of seasonal gas
requirements for Duke Energy Ohio and Duke Energy
Kentucky. Duke Energy Ohio and Duke Energy Kentucky use
primarily fixed-price forward contracts and contracts with a ceiling
and floor on the price. As of December 31, 2011, Duke Energy Ohio
and Duke Energy Kentucky, combined, had locked in pricing for
19% of their winter 2012/2013 system load requirements.
USFE&G is also responsible for the purchase and the
subsequent delivery of natural gas to the gas turbine generators to
serve native electric load customers in the Duke Energy Carolinas,
Duke Energy Indiana and Duke Energy Kentucky service territories.
11