Duke Energy 2011 Annual Report Download - page 186
Download and view the complete annual report
Please find page 186 of the 2011 Duke Energy annual report below. You can navigate through the pages in the report by either clicking on the pages listed below, or by using the keyword search tool below to find specific information within the annual report.-
 1
1 -
2
-
3
-
4
-
5
-
6
-
7
-
8
-
9
-
10
-
11
-
12
-
13
-
14
-
15
-
16
-
17
-
18
-
19
-
20
-
21
-
22
-
23
-
24
-
25
-
26
-
27
-
28
-
29
-
30
-
31
-
32
-
33
-
34
-
35
-
36
-
37
-
38
-
39
-
40
-
41
-
42
-
43
-
44
-
45
-
46
-
47
-
48
-
49
-
50
-
51
-
52
-
53
-
54
-
55
-
56
-
57
-
58
-
59
-
60
-
61
-
62
-
63
-
64
-
65
-
66
-
67
-
68
-
69
-
70
-
71
-
72
-
73
-
74
-
75
-
76
-
77
-
78
-
79
-
80
-
81
-
82
-
83
-
84
-
85
-
86
-
87
-
88
-
89
-
90
-
91
-
92
-
93
-
94
-
95
-
96
-
97
-
98
-
99
-
100
-
101
-
102
-
103
-
104
-
105
-
106
-
107
-
108
-
109
-
110
-
111
-
112
-
113
-
114
-
115
-
116
-
117
-
118
-
119
-
120
-
121
-
122
-
123
-
124
-
125
-
126
-
127
-
128
-
129
-
130
-
131
-
132
-
133
-
134
-
135
-
136
-
137
-
138
-
139
-
140
-
141
-
142
-
143
-
144
-
145
-
146
-
147
-
148
-
149
-
150
-
151
-
152
-
153
-
154
-
155
-
156
-
157
-
158
-
159
-
160
-
161
-
162
-
163
-
164
-
165
-
166
-
167
-
168
-
169
-
170
-
171
-
172
-
173
-
174
-
175
-
 176
176 -
 177
177 -
 178
178 -
 179
179 -
 180
180 -
 181
181 -
 182
182 -
 183
183 -
 184
184 -
 185
185 -
 186
186 -
 187
187 -
 188
188 -
 189
189 -
 190
190 -
 191
191 -
 192
192 -
 193
193 -
 194
194 -
 195
195 -
 196
196 -
197
-
198
-
199
-
200
-
201
-
202
-
203
-
204
-
205
-
206
-
207
-
208
-
209
-
210
-
211
-
212
-
213
-
214
-
215
-
216
-
217
-
218
-
219
-
220
-
221
-
222
-
223
-
224
-
225
-
226
-
227
-
228
-
229
-
230
-
231
-
232
-
233
-
234
-
235
-
236
-
237
-
238
-
239
-
240
-
241
-
242
-
243
-
244
-
245
-
246
-
247
-
248
-
249
-
250
-
251
-
252
-
253
-
254
-
255
-
256
-
257
-
258
-
259
-
260
-
261
-
262
-
263
-
264
-
265
-
266
-
267
-
268
-
269
-
270
-
271
-
272
-
273
-
274
-
275
 |
 |

PART II
DUKE ENERGY CORPORATION •DUKE ENERGY CAROLINAS, LLC •DUKE ENERGY OHIO, INC. •DUKE ENERGY INDIANA, INC.
Combined Notes to Consolidated Financial Statements – (Continued)
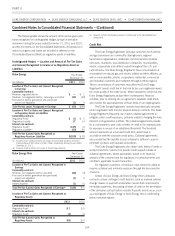
frequency and volume to provide ongoing pricing information.
Duke Energy does not adjust quoted market prices on Level 1
for any blockage factor.
Level 2 — a fair value measurement utilizing inputs other than
a quoted market price that are observable, either directly or
indirectly, for the asset or liability. Level 2 inputs include, but are
not limited to, quoted prices for similar assets or liabilities in an
active market, quoted prices for identical or similar assets or
liabilities in markets that are not active and inputs other than
quoted market prices that are observable for the asset or liability,
such as interest rate curves and yield curves observable at
commonly quoted intervals, volatilities, credit risk and default
rates. A Level 2 measurement cannot have more than an
insignificant portion of the valuation based on unobservable
inputs.
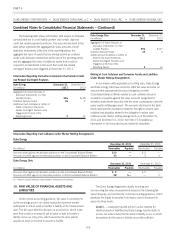
Level 3 — any fair value measurements which include
unobservable inputs for the asset or liability for more than an
insignificant portion of the valuation. A Level 3 measurement
may be based primarily on Level 2 inputs.
The fair value accounting guidance for financial instruments
permits entities to elect to measure many financial instruments and
certain other items at fair value that are not required to be accounted
for at fair value under other GAAP. There are no financial assets or
financial liabilities that are not required to be accounted for at fair
value under GAAP for which the option to record at fair value has
been elected. However, in the future, the Duke Energy Registrants
may elect to measure certain financial instruments at fair value in
accordance with this accounting guidance.
Valuation methods of the primary fair value measurements
disclosed below are as follows:
Investments in equity securities.
Investments in equity securities are typically valued at the
closing price in the principal active market as of the last business day
of the period. Principal active markets for equity prices include
published exchanges such as NASDAQ and NYSE. Foreign equity
prices are translated from their trading currency using the currency
exchange rate in effect at the close of the principal active market.
Prices have not been adjusted to reflect for after-hours market activity.
The majority of investments in equity securities are valued using
Level 1 measurements.
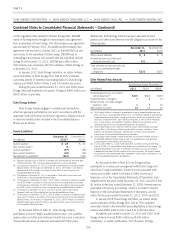
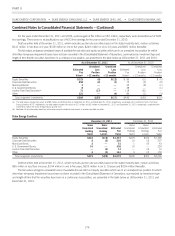
Investments in available-for-sale auction rate securities.
Duke Energy held $89 million par value ($71 million carrying
value) and $149 million par value ($118 million carrying value) as
of December 31, 2011, and December 31, 2010, respectively of
auction rate securities for which an active market does not currently
exist. During the year ended December 31, 2011, $59 million of
these investments in auction rate securities were redeemed at full par
value plus accrued interest. Duke Energy Carolinas held $16 million
par value ($12 million carrying value) of auction rate securities at
both December 31, 2011, and December 31, 2010. All of these
auction rate securities are student loan securities for which
substantially all the values are ultimately backed by the U.S.
government, and the majority of these securities are AAA rated. As of
December 31, 2011 all of these auction rate securities are classified
as long-term investments and are valued using Level 3
measurements. The methods and significant assumptions used to
determine the fair values of the investment in auction rate debt
securities represent estimations of fair value using internal discounted
cash flow models which incorporate primarily management’s own
assumptions as to the term over which such investments will be
recovered at par, the current level of interest rates, and the
appropriate risk-adjusted discount rates when relevant observable
inputs are not available to determine the present value of such cash
flows. In preparing the valuations, all significant value drivers were
considered, including the underlying collateral. Auction rate securities
which are classified as Short-term investments are valued using
Level 2 measurements, as they are valued at par based on a
commitment by the issuer to redeem at par value. There were no
auction rate securities classified as Short-term investments as of
December 31, 2011 or December 31, 2010.
There were no other-than-temporary impairments associated
with investments in auction rate debt securities during the years
ended December 31, 2011, 2010, or 2009.
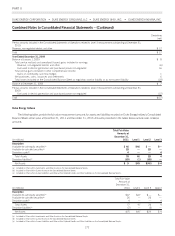
Investments in debt securities.
Most debt investments (including those held in the NDTF) are
valued based on a calculation using interest rate curves and credit
spreads applied to the terms of the debt instrument (maturity and
coupon interest rate) and consider the counterparty credit rating. Most
debt valuations are Level 2 measurements. If the market for a
particular fixed income security is relatively inactive or illiquid, the
valuation is a Level 3 measurement. U.S. Treasury debt is typically a
Level 1 measurement.
Commodity derivatives.
The pricing for commodity derivatives is primarily a calculated
value which incorporates the forward price and is adjusted for
liquidity (bid-ask spread), credit or non-performance risk (after
reflecting credit enhancements such as collateral) and discounted to
present value. The primary difference between a Level 2 and a Level
3 measurement has to do with the level of activity in forward markets
for the commodity. If the market is relatively inactive, the
measurement is deemed to be a Level 3 measurement. Some
commodity derivatives are NYMEX contracts, which are classified as
Level 1 measurements.
Goodwill and Long-Lived Assets.
See Note 12 for a discussion of the valuation for goodwill and
long-lived assets.
166