Duke Energy 2011 Annual Report Download - page 216
Download and view the complete annual report
Please find page 216 of the 2011 Duke Energy annual report below. You can navigate through the pages in the report by either clicking on the pages listed below, or by using the keyword search tool below to find specific information within the annual report.-
 1
1 -
2
-
3
-
4
-
5
-
6
-
7
-
8
-
9
-
10
-
11
-
12
-
13
-
14
-
15
-
16
-
17
-
18
-
19
-
20
-
21
-
22
-
23
-
24
-
25
-
26
-
27
-
28
-
29
-
30
-
31
-
32
-
33
-
34
-
35
-
36
-
37
-
38
-
39
-
40
-
41
-
42
-
43
-
44
-
45
-
46
-
47
-
48
-
49
-
50
-
51
-
52
-
53
-
54
-
55
-
56
-
57
-
58
-
59
-
60
-
61
-
62
-
63
-
64
-
65
-
66
-
67
-
68
-
69
-
70
-
71
-
72
-
73
-
74
-
75
-
76
-
77
-
78
-
79
-
80
-
81
-
82
-
83
-
84
-
85
-
86
-
87
-
88
-
89
-
90
-
91
-
92
-
93
-
94
-
95
-
96
-
97
-
98
-
99
-
100
-
101
-
102
-
103
-
104
-
105
-
106
-
107
-
108
-
109
-
110
-
111
-
112
-
113
-
114
-
115
-
116
-
117
-
118
-
119
-
120
-
121
-
122
-
123
-
124
-
125
-
126
-
127
-
128
-
129
-
130
-
131
-
132
-
133
-
134
-
135
-
136
-
137
-
138
-
139
-
140
-
141
-
142
-
143
-
144
-
145
-
146
-
147
-
148
-
149
-
150
-
151
-
152
-
153
-
154
-
155
-
156
-
157
-
158
-
159
-
160
-
161
-
162
-
163
-
164
-
165
-
166
-
167
-
168
-
169
-
170
-
171
-
172
-
173
-
174
-
175
-
176
-
177
-
178
-
179
-
180
-
181
-
182
-
183
-
184
-
185
-
186
-
187
-
188
-
189
-
190
-
191
-
192
-
193
-
194
-
195
-
196
-
197
-
198
-
199
-
200
-
201
-
202
-
203
-
204
-
205
-
 206
206 -
 207
207 -
 208
208 -
 209
209 -
 210
210 -
 211
211 -
 212
212 -
 213
213 -
 214
214 -
 215
215 -
 216
216 -
 217
217 -
 218
218 -
 219
219 -
 220
220 -
 221
221 -
 222
222 -
 223
223 -
 224
224 -
 225
225 -
 226
226 -
227
-
228
-
229
-
230
-
231
-
232
-
233
-
234
-
235
-
236
-
237
-
238
-
239
-
240
-
241
-
242
-
243
-
244
-
245
-
246
-
247
-
248
-
249
-
250
-
251
-
252
-
253
-
254
-
255
-
256
-
257
-
258
-
259
-
260
-
261
-
262
-
263
-
264
-
265
-
266
-
267
-
268
-
269
-
270
-
271
-
272
-
273
-
274
-
275
 |
 |

PART II
DUKE ENERGY CORPORATION •DUKE ENERGY CAROLINAS, LLC •DUKE ENERGY OHIO, INC. •DUKE ENERGY INDIANA, INC.
Combined Notes to Consolidated Financial Statements – (Continued)
DUKE ENERGY CAROLINAS
Duke Energy Retirement Plans.
Duke Energy Carolinas participates in Duke Energy sponsored
qualified non-contributory defined benefit retirement plans. The plans
cover most U.S. employees using a cash balance formula. Under a
cash balance formula, a plan participant accumulates a retirement
benefit consisting of pay credits that are based upon a percentage
(which may vary with age and years of service) of current eligible
earnings and current interest credits. Duke Energy Carolinas also
participates in Duke Energy sponsored non-qualified,
non-contributory defined benefit pension plans which cover certain
executives.
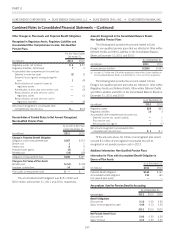
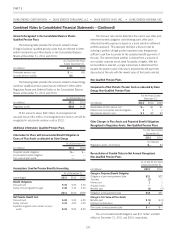
Duke Energy’s policy is to fund amounts on an actuarial basis to
provide assets sufficient to meet benefits to be paid to plan
participants. The following table includes information related to Duke
Energy Carolinas’ contributions to Duke Energy’s qualified defined
benefit pension plans.
Years Ended December 31,
(in millions) 2012 2011 2010 2009
Contributions made — $33 $158 $158
Anticipated contributions $66 — — —
Actuarial gains and losses subject to amortization are amortized
over the average remaining service period of the active employees.
The average remaining service period of the active employees covered
by the qualified retirement plans is nine years. The average remaining
service period of active employees covered by the non-qualified
retirement plans is also nine years. Duke Energy determines the
market-related value of plan assets using a calculated value that
recognizes changes in fair value of the plan assets in a particular year
on a straight-line basis over the next five years.
Net periodic pension costs disclosed in the tables below for the
qualified, non-qualified and other post-retirement benefit plans
represent the cost of the respective plan for the periods presented.
However, portions of the net periodic pension costs (benefits)
disclosed in the tables have been capitalized as a component of
property, plant and equipment.
Duke Energy uses a December 31 measurement date for its
defined benefit retirement plan assets and obligations.
Amounts presented in the tables below represent the amounts
of pension and other post-retirement benefit cost allocated by Duke
Energy for employees of Duke Energy Carolinas. Additionally, Duke
Energy Carolinas is allocated its proportionate share of pension and
other post-retirement benefit cost for employees of Duke Energy’s
shared services affiliate that provides support to Duke Energy
Carolinas. These allocated amounts are included in the governance
andsharedservicescostsdiscussedinNote13.
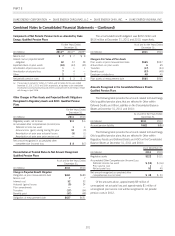
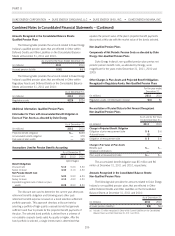
Qualified Pension Plans
Components of Net Periodic Pension (Benefit) Costs as allocated
by Duke Energy: Qualified Pension Plans
For the Years Ended
December 31,
(in millions) 2011 2010 2009
Service cost $37 $36 $31
Interest cost on projected benefit obligation 85 91 95
Expected return on plan assets (150) (147) (142)
Amortization of prior service cost 111
Amortization of actuarial loss 37 27 2
Other 787
Net periodic pension costs (benefit) $17 $16 $ (6)
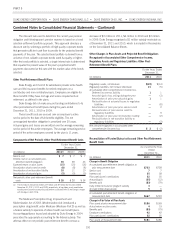
Other Changes in Plan Assets and Projected Benefit Obligations
Recognized in Regulatory Assets: Qualified Pension Plans
For the Years Ended
December 31,
(in millions) 2011 2010
Regulatory assets, net increase $65 $628
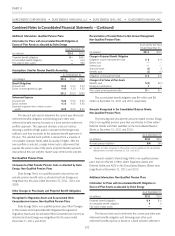
Reconciliation of Funded Status to Net Amount Recognized:
Qualified Pension Plans
As of and for the Years
Ended December 31,
(in millions) 2011 2010
Change in Projected Benefit Obligation
Obligation at prior measurement date $1,786 $1,737
Service cost 37 36
Interest cost 85 91
Actuarial losses 20 57
Transfers (5) (5)
Plan amendments 13 —
Benefits paid (105) (130)
Obligation at measurement date $1,831 $1,786
The accumulated benefit obligation was $1,787 million and
$1,743 million at December 31, 2011 and 2010, respectively.
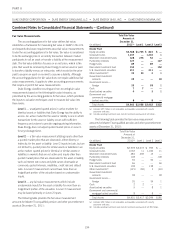
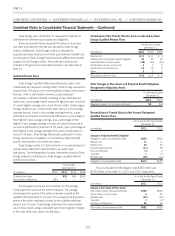
As of and for the Years
Ended December 31,
(in millions) 2011 2010
Change in Fair Value of Plan Assets
Plan assets at prior measurement date $1,837 $1,602
Actualreturnonplanassets 60 212
Benefits paid (105) (130)
Transfers (5) (5)
Employer contributions 33 158
Plan assets at measurement date $1,820 $1,837
196