Duke Energy 2011 Annual Report Download - page 231
Download and view the complete annual report
Please find page 231 of the 2011 Duke Energy annual report below. You can navigate through the pages in the report by either clicking on the pages listed below, or by using the keyword search tool below to find specific information within the annual report.-
 1
1 -
2
-
3
-
4
-
5
-
6
-
7
-
8
-
9
-
10
-
11
-
12
-
13
-
14
-
15
-
16
-
17
-
18
-
19
-
20
-
21
-
22
-
23
-
24
-
25
-
26
-
27
-
28
-
29
-
30
-
31
-
32
-
33
-
34
-
35
-
36
-
37
-
38
-
39
-
40
-
41
-
42
-
43
-
44
-
45
-
46
-
47
-
48
-
49
-
50
-
51
-
52
-
53
-
54
-
55
-
56
-
57
-
58
-
59
-
60
-
61
-
62
-
63
-
64
-
65
-
66
-
67
-
68
-
69
-
70
-
71
-
72
-
73
-
74
-
75
-
76
-
77
-
78
-
79
-
80
-
81
-
82
-
83
-
84
-
85
-
86
-
87
-
88
-
89
-
90
-
91
-
92
-
93
-
94
-
95
-
96
-
97
-
98
-
99
-
100
-
101
-
102
-
103
-
104
-
105
-
106
-
107
-
108
-
109
-
110
-
111
-
112
-
113
-
114
-
115
-
116
-
117
-
118
-
119
-
120
-
121
-
122
-
123
-
124
-
125
-
126
-
127
-
128
-
129
-
130
-
131
-
132
-
133
-
134
-
135
-
136
-
137
-
138
-
139
-
140
-
141
-
142
-
143
-
144
-
145
-
146
-
147
-
148
-
149
-
150
-
151
-
152
-
153
-
154
-
155
-
156
-
157
-
158
-
159
-
160
-
161
-
162
-
163
-
164
-
165
-
166
-
167
-
168
-
169
-
170
-
171
-
172
-
173
-
174
-
175
-
176
-
177
-
178
-
179
-
180
-
181
-
182
-
183
-
184
-
185
-
186
-
187
-
188
-
189
-
190
-
191
-
192
-
193
-
194
-
195
-
196
-
197
-
198
-
199
-
200
-
201
-
202
-
203
-
204
-
205
-
206
-
207
-
208
-
209
-
210
-
211
-
212
-
213
-
214
-
215
-
216
-
217
-
218
-
219
-
220
-
 221
221 -
 222
222 -
 223
223 -
 224
224 -
 225
225 -
 226
226 -
 227
227 -
 228
228 -
 229
229 -
 230
230 -
 231
231 -
 232
232 -
 233
233 -
 234
234 -
 235
235 -
 236
236 -
 237
237 -
 238
238 -
 239
239 -
 240
240 -
 241
241 -
242
-
243
-
244
-
245
-
246
-
247
-
248
-
249
-
250
-
251
-
252
-
253
-
254
-
255
-
256
-
257
-
258
-
259
-
260
-
261
-
262
-
263
-
264
-
265
-
266
-
267
-
268
-
269
-
270
-
271
-
272
-
273
-
274
-
275
 |
 |

PART II
DUKE ENERGY CORPORATION •DUKE ENERGY CAROLINAS, LLC •DUKE ENERGY OHIO, INC. •DUKE ENERGY INDIANA, INC.
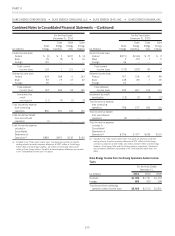
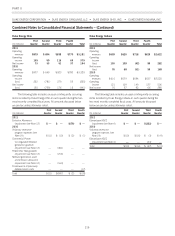
Combined Notes to Consolidated Financial Statements – (Continued)
Reconciliation of Income Tax Expense at the U.S. Federal
Statutory Tax Rate to the Actual Tax Expense from Continuing
Operations (Statutory Rate Reconciliation)
For the Year Ended
December 31, 2011
(in millions)
Duke
Energy
Duke
Energy
Carolinas
Duke
Energy
Ohio
Duke
Energy
Indiana
Income tax expense,
computed at the statutory
rate of 35% $863 $457 $102 $ 85
State income tax, net of
federal income tax
effect 50 46 (1) 13
Tax differential on
foreign earnings (44) — — —
AFUDC equity income (91) (59) (2) (31)
Other items, net (26) 28 (3) 7
Total income tax
expense from
continuing
operations $752 $472 $ 96 $ 74
Effective tax rate 30.5% 36.1% 33.1% 30.6%
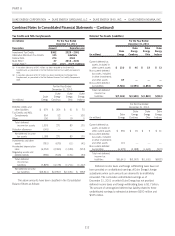
For the Year Ended
December 31, 2010
(in millions)
Duke
Energy
Duke
Energy
Carolinas
Duke
Energy
Ohio
Duke
Energy
Indiana
Income tax expense,
computed at the statutory
rate of 35% $ 774 $ 454 $ (108) $ 155
State income tax, net of
federal income tax
effect 82 48 14 26
Tax differential on
foreign earnings (22) — — —
Goodwill impairment
charges 175 — 237 —
AFUDC equity income (82) (61) (2) (20)
Other items, net (37) 16 (9) (5)
Total income tax
expense from
continuing
operations $ 890 $ 457 $ 132 $ 156
Effective tax rate 40.3% 35.3% (43.0)% 35.5%
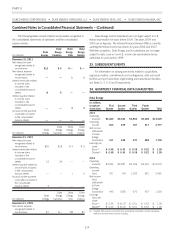
For the Year Ended
December 31, 2009
(in millions)
Duke
Energy
Duke
Energy
Carolinas
Duke
Energy
Ohio
Duke
Energy
Indiana
Income tax expense, computed at
the statutory rate of 35% $ 641 $ 378 $ (84) $ 111
State income tax, net of federal
income tax effect 98 40 9 18
Tax differential on foreign
earnings (16) — — —
Goodwill impairment charges 130 — 254 —
AFUDC equity income (53) (44) 1 (10)
Other items, net (42) 3 6 (3)
Total income tax expense
from continuing
operations $ 758 $ 377 $ 186 $ 116
Effective tax rate 41.4% 34.9% (77.5)% 36.7%
Valuation allowances have been established for certain foreign
and state net operating loss carryforwards that reduce deferred tax
assets to an amount that will be realized on a more-likely-than-not
basis. The net change in the total valuation allowance is included in
Tax differential on foreign earnings and State income tax, net of
federal income tax effect in the above table.
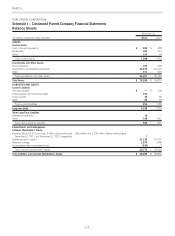
Net Deferred Income Tax Liability Components
For the Year Ended
December 31, 2011
(in millions)
Duke
Energy
Duke
Energy
Carolinas
Duke
Energy
Ohio
Duke
Energy
Indiana
2Deferred credits and other
liabilities $ 790 $ 228 $ 68 $ 92
TaxCreditsandNOL
Carryforwards(a) 930 199 — 95
Investments and other assets —— 3—
Other 137 18 31 5
Total deferred income tax
assets 1,857 445 102 192
Valuation allowance (144)———
Net deferred income tax
assets 1,713 445 102 192
Investments and other assets (809) (720) — (2)
Accelerated depreciation rates (6,989) (3,576) (1,706) (968)
Regulatory assets and deferred
debits (1,219) (658) (216) (136)
Total deferred income tax
liabilities (9,017) (4,954) (1,922) (1,106)
Net deferred income tax
liabilities $(7,304) $(4,509) $(1,820) $ (914)
(a) See Tax Credits and NOL Carryforwards table below.
211