Duke Energy 2011 Annual Report Download - page 174
Download and view the complete annual report
Please find page 174 of the 2011 Duke Energy annual report below. You can navigate through the pages in the report by either clicking on the pages listed below, or by using the keyword search tool below to find specific information within the annual report.-
 1
1 -
2
-
3
-
4
-
5
-
6
-
7
-
8
-
9
-
10
-
11
-
12
-
13
-
14
-
15
-
16
-
17
-
18
-
19
-
20
-
21
-
22
-
23
-
24
-
25
-
26
-
27
-
28
-
29
-
30
-
31
-
32
-
33
-
34
-
35
-
36
-
37
-
38
-
39
-
40
-
41
-
42
-
43
-
44
-
45
-
46
-
47
-
48
-
49
-
50
-
51
-
52
-
53
-
54
-
55
-
56
-
57
-
58
-
59
-
60
-
61
-
62
-
63
-
64
-
65
-
66
-
67
-
68
-
69
-
70
-
71
-
72
-
73
-
74
-
75
-
76
-
77
-
78
-
79
-
80
-
81
-
82
-
83
-
84
-
85
-
86
-
87
-
88
-
89
-
90
-
91
-
92
-
93
-
94
-
95
-
96
-
97
-
98
-
99
-
100
-
101
-
102
-
103
-
104
-
105
-
106
-
107
-
108
-
109
-
110
-
111
-
112
-
113
-
114
-
115
-
116
-
117
-
118
-
119
-
120
-
121
-
122
-
123
-
124
-
125
-
126
-
127
-
128
-
129
-
130
-
131
-
132
-
133
-
134
-
135
-
136
-
137
-
138
-
139
-
140
-
141
-
142
-
143
-
144
-
145
-
146
-
147
-
148
-
149
-
150
-
151
-
152
-
153
-
154
-
155
-
156
-
157
-
158
-
159
-
160
-
161
-
162
-
163
-
 164
164 -
 165
165 -
 166
166 -
 167
167 -
 168
168 -
 169
169 -
 170
170 -
 171
171 -
 172
172 -
 173
173 -
 174
174 -
 175
175 -
 176
176 -
 177
177 -
 178
178 -
 179
179 -
 180
180 -
 181
181 -
 182
182 -
 183
183 -
 184
184 -
185
-
186
-
187
-
188
-
189
-
190
-
191
-
192
-
193
-
194
-
195
-
196
-
197
-
198
-
199
-
200
-
201
-
202
-
203
-
204
-
205
-
206
-
207
-
208
-
209
-
210
-
211
-
212
-
213
-
214
-
215
-
216
-
217
-
218
-
219
-
220
-
221
-
222
-
223
-
224
-
225
-
226
-
227
-
228
-
229
-
230
-
231
-
232
-
233
-
234
-
235
-
236
-
237
-
238
-
239
-
240
-
241
-
242
-
243
-
244
-
245
-
246
-
247
-
248
-
249
-
250
-
251
-
252
-
253
-
254
-
255
-
256
-
257
-
258
-
259
-
260
-
261
-
262
-
263
-
264
-
265
-
266
-
267
-
268
-
269
-
270
-
271
-
272
-
273
-
274
-
275
 |
 |

PART II
DUKE ENERGY CORPORATION •DUKE ENERGY CAROLINAS, LLC •DUKE ENERGY OHIO, INC. •DUKE ENERGY INDIANA, INC.
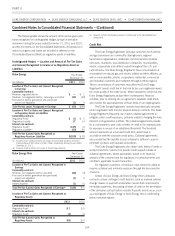
Combined Notes to Consolidated Financial Statements – (Continued)
Emission allowances in the tables above include emission
allowances acquired by Duke Energy as part of its merger with
Cinergy, which were recorded at the then fair value on the date of the
merger in April 2006, and emission allowances purchased by Duke
Energy. Additionally, Duke Energy is allocated certain zero cost
emission allowances on an annual basis.
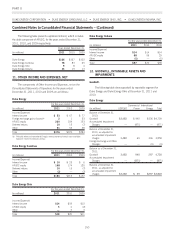
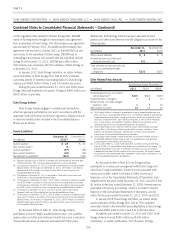
The change in the gross carrying value of emission allowances
during the years ended December 31, 2011 and 2010 are as
follows:
December 31, 2011
(in millions) Duke Energy
Duke Energy
Ohio
Duke Energy
Indiana
Gross carrying value at
beginning of period $175 $125 $ 49
Purchases of emission
allowances 412
Sales and consumption of
emission allowances(a)(b) (39) (18) (21)
Impairment of emission
allowances (79) (79) —
Other changes 5— 7
Gross carrying value at end of
period $66 $29 $37
December 31, 2010
(in millions) Duke Energy
Duke Energy
Ohio
Duke Energy
Indiana
Gross carrying value at beginning
of period $274 $191 $ 82
Purchases of emission
allowances 14 12 1
Sales and consumption of
emission allowances(a)(b) (66) (31) (34)
Other changes (47) (47) —
———
Gross carrying value at end of
period $175 $125 $ 49
(a) Carrying value of emission allowances arerecognizedviaachargetoexpensewhen
consumed.
(b) See Note 3 for a discussion of gains and losses on sales of emission allowances by
USFE&G and Commercial Power.
Amortization expense for gas, coal and power contracts, wind
development rights and other intangible assets for the years ended
December 31, 2011, 2010 and 2009 was:
(in millions) 2011 2010 2009
Duke Energy $10 $24 $25
Duke Energy Ohio 820 23
Duke Energy Indiana 111
The table below shows the expected amortization expense for
the next five years for intangible assets as of December 31, 2011.
The expected amortization expense includes estimates of emission
allowances consumption and estimates of consumption of
commodities such as gas and coal under existing contracts, as well
as estimated amortization related to the wind development projects
acquired from Catamount. The amortization amounts discussed
below are estimates and actual amounts may differ from these
estimates due to such factors as changes in consumption patterns,
sales or impairments of emission allowances or other intangible
assets, delays in the in-service dates of wind assets, additional
intangible acquisitions and other events.
Amortization Expense
(in millions) 2012 2013 2014 2015 2016
Duke Energy $60 $17 $17 $16 $16
Duke Energy Ohio 16 11 10 10 9
DukeEnergyIndiana 381111
Emission Allowance Impairments.
On August 8, 2011, the EPA published its final CSAPR in the
Federal Register. As further discussed in Note 5, the CSAPR
established state-level annual SO2and NOxbudgets that were to take
effect on January 1, 2012, and state-level ozone-season NOxbudgets
that were to take effect on May 1, 2012, allocating emission
allowances to affected sources in each state equal to the state budget
less an allowance set-aside for new sources. The budget levels were
set to decline in 2014 for many states, including each state that the
Duke Energy Registrants operate in, except for South Carolina where
the budget levels were to remain constant. The rule allowed both
intrastate and interstate allowance trading.
The CSAPR will not utilize CAA emission allowances as the
original CAIR provided. The EPA will issue new emission allowances
to be used exclusively for purposes of complying with the CSAPR
cap-and-trade program. Duke Energy has evaluated the effect of the
CSAPR on the carrying value of emission allowances recorded at its
USFE&G and Commercial Power segments. Based on the provisions
oftheCSAPRwhentherulewaspublished,DukeEnergyOhiohad
more SO2allowances than will be needed to comply with the
continuing CAA acid rain cap-and-trade program (excess emission
allowances). Duke Energy Ohio incurred a pre-tax impairment of $79
million in the third quarter of 2011 to write down the carrying value
of excess emission allowances held by Commercial Power to fair
value. The charge is recorded in Goodwill and other impairment
charges on Duke Energy and Duke Energy Ohio’s Consolidated
Statement of Operations. This amount was based on the fair value of
total allowances held by Commercial Power for compliance under the
continuing CAA acid rain cap-and-trade program on August 8, 2011.
As discussed in Note 5, on December 30, 2011, the D.C.
District Court ordered a stay of the CSAPR. Based on the court’s
order, the EPA is expected to continue administering the CAIR that
the Duke Energy Registrants have been complying with since 2009
and which was to be replaced by the CSAPR beginning in 2012.
154