Duke Energy 2011 Annual Report Download - page 101
Download and view the complete annual report
Please find page 101 of the 2011 Duke Energy annual report below. You can navigate through the pages in the report by either clicking on the pages listed below, or by using the keyword search tool below to find specific information within the annual report.-
 1
1 -
2
-
3
-
4
-
5
-
6
-
7
-
8
-
9
-
10
-
11
-
12
-
13
-
14
-
15
-
16
-
17
-
18
-
19
-
20
-
21
-
22
-
23
-
24
-
25
-
26
-
27
-
28
-
29
-
30
-
31
-
32
-
33
-
34
-
35
-
36
-
37
-
38
-
39
-
40
-
41
-
42
-
43
-
44
-
45
-
46
-
47
-
48
-
49
-
50
-
51
-
52
-
53
-
54
-
55
-
56
-
57
-
58
-
59
-
60
-
61
-
62
-
63
-
64
-
65
-
66
-
67
-
68
-
69
-
70
-
71
-
72
-
73
-
74
-
75
-
76
-
77
-
78
-
79
-
80
-
81
-
82
-
83
-
84
-
85
-
86
-
87
-
88
-
89
-
90
-
 91
91 -
 92
92 -
 93
93 -
 94
94 -
 95
95 -
 96
96 -
 97
97 -
 98
98 -
 99
99 -
 100
100 -
 101
101 -
 102
102 -
 103
103 -
 104
104 -
 105
105 -
 106
106 -
 107
107 -
 108
108 -
 109
109 -
 110
110 -
 111
111 -
112
-
113
-
114
-
115
-
116
-
117
-
118
-
119
-
120
-
121
-
122
-
123
-
124
-
125
-
126
-
127
-
128
-
129
-
130
-
131
-
132
-
133
-
134
-
135
-
136
-
137
-
138
-
139
-
140
-
141
-
142
-
143
-
144
-
145
-
146
-
147
-
148
-
149
-
150
-
151
-
152
-
153
-
154
-
155
-
156
-
157
-
158
-
159
-
160
-
161
-
162
-
163
-
164
-
165
-
166
-
167
-
168
-
169
-
170
-
171
-
172
-
173
-
174
-
175
-
176
-
177
-
178
-
179
-
180
-
181
-
182
-
183
-
184
-
185
-
186
-
187
-
188
-
189
-
190
-
191
-
192
-
193
-
194
-
195
-
196
-
197
-
198
-
199
-
200
-
201
-
202
-
203
-
204
-
205
-
206
-
207
-
208
-
209
-
210
-
211
-
212
-
213
-
214
-
215
-
216
-
217
-
218
-
219
-
220
-
221
-
222
-
223
-
224
-
225
-
226
-
227
-
228
-
229
-
230
-
231
-
232
-
233
-
234
-
235
-
236
-
237
-
238
-
239
-
240
-
241
-
242
-
243
-
244
-
245
-
246
-
247
-
248
-
249
-
250
-
251
-
252
-
253
-
254
-
255
-
256
-
257
-
258
-
259
-
260
-
261
-
262
-
263
-
264
-
265
-
266
-
267
-
268
-
269
-
270
-
271
-
272
-
273
-
274
-
275
 |
 |

PART II
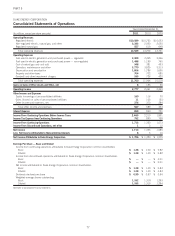
DUKE ENERGY CORPORATION
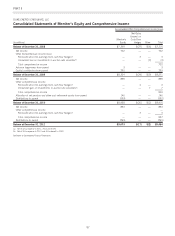
Consolidated Statements of Equity and Comprehensive Income
Duke Energy Corporation Shareholders
Accumulated Other Comprehensive Income (Loss)
(In millions)
Common
Stock
Shares
Common
Stock
Additional
Paid-in
Capital
Retained
Earnings
Foreign
Currency
Adjustments
Net Gains
(Losses) on
Cash Flow
Hedges Other
Pension and
OPEB Related
Adjustments
to AOCI
Common
Stockholders’
Equity
Noncontrolling
Interests
Total
Equity
Balance at December 31, 2008 1,272 $ 1 $ 20,106 $ 1,607 $ (306) $ (41) $ (28) $ (351) $ 20,988 $ 163 $ 21,151
Net income 1,075 1,075 10 1,085
Other Comprehensive income (loss)
Foreign currency translation adjustments — — — — 323 — — — 323 18 341
Net unrealized gain on cash flow hedges(a) —— —— — 1— — 1 — 1
Reclassification into earnings from cash
flow hedges(b) —— —— — 18— — 18 — 18
Pension and OPEB related adjustments to
AOCI(g) —— —— — —— 36 36 — 36
Net actuarial loss(c) — — — — — — — (21) (21) — (21)
Unrealized loss on investments in auction
rate securities(d) — — — — — — (6) — (6) — (6)
Reclassification of gains on investments in
available-for-sale securities into
earnings(e) — — — — — — (5) — (5) — (5)
Unrealized gain on investments in
available-for-sale securities(f) —— —— — —8 — 8 — 8
Total comprehensive income 1,429 28 1,457
Common stock issuances, including dividend
reinvestment and employee benefits 37 — 546 — — — — — 546 — 546
Purchases and other changes in
noncontrolling interest in subsidiaries(h) — — 14 — — — — — 14 (55) (41)
Common stock dividends — — — (1,222) — — — — (1,222) — (1,222)
Other — — (5) — — — — — (5) — (5)
Balance at December 31, 2009 1,309 $ 1 $20,661 $ 1,460 $ 17 $(22) $(31) $(336) $21,750 $136 $21,886
Net income — — — 1,320 — — — — 1,320 3 1,323
Other comprehensive income ——
Foreign currency translation adjustments — — — — 80 — — — 80 (1) 79
Pension and OPEB related adjustments to
AOCI(g) — — — — — — — 276 276 — 276
Net unrealized gain on cash flow hedges(a) —— —— — 1— — 1 — 1
Reclassification into earnings from cash
flow hedges(b) —— —— — 3— — 3 — 3
Unrealized gain on investments in auction
rate securities(d) —— —— — 14 — 14 — 14
Total comprehensive income 1,694 2 1,696
Common stock issuances, including dividend
reinvestment and employee benefits 20 — 362 — — — — — 362 — 362
Common stock dividends — — — (1,284) — — — — (1,284) — (1,284)
Changes in noncontrolling interest in
subsidiaries(h) —— —— — —— — — (7) (7)
Balance at December 31, 2010 1,329 $ 1 $21,023 $ 1,496 $ 97 $(18) $(17) $ (60) $22,522 $131 $22,653
Net income — — — 1,706 — — — — 1,706 8 1,714
Other comprehensive (loss) income ——
Foreign currency translation adjustments — — — — (142) — — — (142) (7) (149)
Pension and OPEB related adjustments to
AOCI(g) — — — — — — — (49) (49) — (49)
Net unrealized loss on cash flow hedges(a) — — — — — (57) — — (57) — (57)
Reclassification into earnings from cash
flow hedges(b) —— —— — 4— — 4 — 4
Unrealized gain on investments in auction
rate securities(d) —— —— — 8 8 — 8
Reclassification of gains on investments in
available-for-sale securities into
earnings(e) — — — — — — (4) — (4) — (4)
Unrealized gain on investments in
available-for-sale securities(f) —— —— — —4 — 4 — 4
Total comprehensive income 1,470 1 1,471
Common stock issuances, including dividend
reinvestment and employee benefits 7 — 109 — — — — — 109 — 109
Common stock dividends — — — (1,329) — — — — (1,329) — (1,329)
Changes in noncontrolling interest in
subsidiaries(h) — — — — — — — — — (39) (39)
Balance at December 31, 2011 1,336 $ 1 $21,132 $ 1,873 $ (45) $(71) $ (9) $(109) $22,772 $ 93 $22,865
(a) Net of $31 tax benefit in 2011, $1 tax expense in 2010, and $1 tax expense in 2009.
(b) Net of $1 tax expense in 2011, insignificant tax expense in 2010 and $10 tax expense in 2009.
(c) Net of $12 tax benefit in 2009.
(d) Net of $4 tax expense in 2011, $8 tax expense in 2010 and $4 tax benefit in 2009.
(e) Net of $2 tax benefit in 2011 and $2 tax expense in 2009.
(f) Net of $3 tax expense in 2011 and $4 tax expense in 2009.
(g) Net of $23 tax benefit in 2011, $150 tax expense in 2010 and $16 tax expense in 2009.
(h) Includes $26, $10, and $37 in cash distributions to noncontrolling interests in 2011, 2010, and 2009 respectively.
See Notes to Consolidated Financial Statements
81