Duke Energy 2011 Annual Report Download - page 123
Download and view the complete annual report
Please find page 123 of the 2011 Duke Energy annual report below. You can navigate through the pages in the report by either clicking on the pages listed below, or by using the keyword search tool below to find specific information within the annual report.-
 1
1 -
2
-
3
-
4
-
5
-
6
-
7
-
8
-
9
-
10
-
11
-
12
-
13
-
14
-
15
-
16
-
17
-
18
-
19
-
20
-
21
-
22
-
23
-
24
-
25
-
26
-
27
-
28
-
29
-
30
-
31
-
32
-
33
-
34
-
35
-
36
-
37
-
38
-
39
-
40
-
41
-
42
-
43
-
44
-
45
-
46
-
47
-
48
-
49
-
50
-
51
-
52
-
53
-
54
-
55
-
56
-
57
-
58
-
59
-
60
-
61
-
62
-
63
-
64
-
65
-
66
-
67
-
68
-
69
-
70
-
71
-
72
-
73
-
74
-
75
-
76
-
77
-
78
-
79
-
80
-
81
-
82
-
83
-
84
-
85
-
86
-
87
-
88
-
89
-
90
-
91
-
92
-
93
-
94
-
95
-
96
-
97
-
98
-
99
-
100
-
101
-
102
-
103
-
104
-
105
-
106
-
107
-
108
-
109
-
110
-
111
-
112
-
 113
113 -
 114
114 -
 115
115 -
 116
116 -
 117
117 -
 118
118 -
 119
119 -
 120
120 -
 121
121 -
 122
122 -
 123
123 -
 124
124 -
 125
125 -
 126
126 -
 127
127 -
 128
128 -
 129
129 -
 130
130 -
 131
131 -
 132
132 -
 133
133 -
134
-
135
-
136
-
137
-
138
-
139
-
140
-
141
-
142
-
143
-
144
-
145
-
146
-
147
-
148
-
149
-
150
-
151
-
152
-
153
-
154
-
155
-
156
-
157
-
158
-
159
-
160
-
161
-
162
-
163
-
164
-
165
-
166
-
167
-
168
-
169
-
170
-
171
-
172
-
173
-
174
-
175
-
176
-
177
-
178
-
179
-
180
-
181
-
182
-
183
-
184
-
185
-
186
-
187
-
188
-
189
-
190
-
191
-
192
-
193
-
194
-
195
-
196
-
197
-
198
-
199
-
200
-
201
-
202
-
203
-
204
-
205
-
206
-
207
-
208
-
209
-
210
-
211
-
212
-
213
-
214
-
215
-
216
-
217
-
218
-
219
-
220
-
221
-
222
-
223
-
224
-
225
-
226
-
227
-
228
-
229
-
230
-
231
-
232
-
233
-
234
-
235
-
236
-
237
-
238
-
239
-
240
-
241
-
242
-
243
-
244
-
245
-
246
-
247
-
248
-
249
-
250
-
251
-
252
-
253
-
254
-
255
-
256
-
257
-
258
-
259
-
260
-
261
-
262
-
263
-
264
-
265
-
266
-
267
-
268
-
269
-
270
-
271
-
272
-
273
-
274
-
275
 |
 |

PART II
DUKE ENERGY CORPORATION •DUKE ENERGY CAROLINAS, LLC •DUKE ENERGY OHIO, INC. •DUKE ENERGY INDIANA, INC.
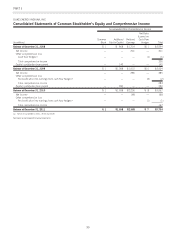
Combined Notes to Consolidated Financial Statements – (Continued)
of reporting units based on discounted future cash flows, and the
market approach, which estimates the fair value of a reporting unit
based on market comparables within the utility and energy industries.
Step two of the goodwill impairment test involves comparing the
implied fair value of the reporting unit’s goodwill against the carrying
value of the goodwill. Under step two, determining the implied fair
value of goodwill requires the valuation of a reporting unit’s
identifiable tangible and intangible assets and liabilities as if the
reporting unit had been acquired in a business combination on the
testing date. The difference between the fair value of the entire
reporting unit as determined in step one and the net fair value of all
identifiable assets and liabilities represents the implied fair value of
goodwill. The goodwill impairment charge, if any, would be the
difference between the carrying amount of goodwill and the implied
fair value of goodwill upon the completion of step two. See Note 12
for further information.
Long-Lived Asset Impairments.
The Duke Energy Registrants evaluate whether long-lived assets,
excluding goodwill, have been impaired when circumstances indicate
the carrying value of those assets may not be recoverable. For such
long-lived assets, an impairment exists when its carrying value
exceeds the sum of estimates of the undiscounted cash flows
expected to result from the use and eventual disposition of the asset.
When alternative courses of action to recover the carrying amount of
a long-lived asset are under consideration, a probability-weighted
approach is used for developing estimates of future undiscounted
cash flows. If the carrying value of the long-lived asset is not
recoverable based on these estimated future undiscounted cash
flows, the impairment loss is measured as the excess of the carrying
value of the asset over its fair value, such that the asset’s carrying
value is adjusted to its estimated fair value.
Management assesses the fair value of long-lived assets using
commonly accepted techniques, and may use more than one source.
Sources to determine fair value include, but are not limited to, recent
third party comparable sales, internally developed discounted cash
flow analysis and analysis from outside advisors. Significant changes
in market conditions resulting from events such as, among others,
changes in commodity prices or the condition of an asset, or a
change in management’s intent to utilize the asset are generally
viewed by management as triggering events to re-assess the cash
flows related to the long-lived assets.
See Note 12 for further information.
Property, Plant and Equipment.
Property, plant and equipment are stated at the lower of
historical cost less accumulated depreciation or fair value, if impaired.
The Duke Energy Registrants capitalize all construction-related direct
labor and material costs, as well as indirect construction costs.
Indirect costs include general engineering, taxes and the cost of funds
used during construction (see “Allowance for Funds Used During
Construction (AFUDC) and Interest Capitalized,” discussed below).
The cost of renewals and betterments that extend the useful life of
property, plant and equipment are also capitalized. The cost of
repairs, replacements and major maintenance projects, which do not
extend the useful life or increase the expected output of the asset, are
expensed as incurred. Depreciation is generally computed over the
estimated useful life of the asset using the composite straight-line
method. For regulated operations, depreciation studies are conducted
periodically to update the composite rates and are approved by the
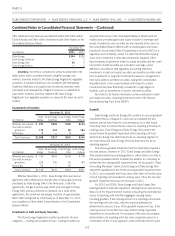
various state commissions. The composite weighted-average
depreciation rates for each of the Duke Energy Registrants were:
December 31,
2011 2010 2009
Duke Energy(a) 3.2% 3.2% 3.3%
Duke Energy Carolinas(a) 2.6% 2.7% 2.0%
Duke Energy Ohio 3.5% 4.1% 3.8%
Duke Energy Indiana 3.4% 3.5% 4.2%
(a) Excludes nuclear fuel.
When the Duke Energy Registrants retire their regulated
property, plant and equipment, it charges the original cost plus the
cost of retirement, less salvage value, to accumulated depreciation,
consistent with regulated rate making practices, if the retirement is
considered a normal retirement. When it (i) sells entire regulated
operating units, (ii) retires or sells non-regulated properties, or
(iii) retires regulated property, plant and equipment and the
retirement is not considered normal, the cost is removed from the
property account and the related accumulated depreciation and
amortization accounts are reduced. Any gain or loss is recorded in
earnings, unless otherwise required by the applicable regulatory body.
See Note 10 for further information on the components and
estimated useful lives of Duke Energy’s property, plant and
equipment.
Nuclear Fuel.
Amortization of nuclear fuel is included within Fuel Used in
Electric Generation and Purchased Power-Regulated in the
Consolidated Statements of Operations. The amortization is recorded
using the units-of-production method.
AFUDC and Interest Capitalized.
In accordance with applicable regulatory accounting guidance,
the Duke Energy Registrants record AFUDC, which represents the
estimated debt and equity costs of capital funds necessary to finance
the construction of new regulated facilities. Both the debt and equity
components of AFUDC are non-cash amounts within the
Consolidated Statements of Operations. AFUDC is capitalized as a
component of the cost of Property, Plant and Equipment, with an
offsetting credit to Other Income and Expenses, net on the
Consolidated Statements of Operations for the equity component and
as an offset to Interest Expense on the Consolidated Statements of
103