Duke Energy 2011 Annual Report Download - page 206
Download and view the complete annual report
Please find page 206 of the 2011 Duke Energy annual report below. You can navigate through the pages in the report by either clicking on the pages listed below, or by using the keyword search tool below to find specific information within the annual report.-
 1
1 -
2
-
3
-
4
-
5
-
6
-
7
-
8
-
9
-
10
-
11
-
12
-
13
-
14
-
15
-
16
-
17
-
18
-
19
-
20
-
21
-
22
-
23
-
24
-
25
-
26
-
27
-
28
-
29
-
30
-
31
-
32
-
33
-
34
-
35
-
36
-
37
-
38
-
39
-
40
-
41
-
42
-
43
-
44
-
45
-
46
-
47
-
48
-
49
-
50
-
51
-
52
-
53
-
54
-
55
-
56
-
57
-
58
-
59
-
60
-
61
-
62
-
63
-
64
-
65
-
66
-
67
-
68
-
69
-
70
-
71
-
72
-
73
-
74
-
75
-
76
-
77
-
78
-
79
-
80
-
81
-
82
-
83
-
84
-
85
-
86
-
87
-
88
-
89
-
90
-
91
-
92
-
93
-
94
-
95
-
96
-
97
-
98
-
99
-
100
-
101
-
102
-
103
-
104
-
105
-
106
-
107
-
108
-
109
-
110
-
111
-
112
-
113
-
114
-
115
-
116
-
117
-
118
-
119
-
120
-
121
-
122
-
123
-
124
-
125
-
126
-
127
-
128
-
129
-
130
-
131
-
132
-
133
-
134
-
135
-
136
-
137
-
138
-
139
-
140
-
141
-
142
-
143
-
144
-
145
-
146
-
147
-
148
-
149
-
150
-
151
-
152
-
153
-
154
-
155
-
156
-
157
-
158
-
159
-
160
-
161
-
162
-
163
-
164
-
165
-
166
-
167
-
168
-
169
-
170
-
171
-
172
-
173
-
174
-
175
-
176
-
177
-
178
-
179
-
180
-
181
-
182
-
183
-
184
-
185
-
186
-
187
-
188
-
189
-
190
-
191
-
192
-
193
-
194
-
195
-
 196
196 -
 197
197 -
 198
198 -
 199
199 -
 200
200 -
 201
201 -
 202
202 -
 203
203 -
 204
204 -
 205
205 -
 206
206 -
 207
207 -
 208
208 -
 209
209 -
 210
210 -
 211
211 -
 212
212 -
 213
213 -
 214
214 -
 215
215 -
 216
216 -
217
-
218
-
219
-
220
-
221
-
222
-
223
-
224
-
225
-
226
-
227
-
228
-
229
-
230
-
231
-
232
-
233
-
234
-
235
-
236
-
237
-
238
-
239
-
240
-
241
-
242
-
243
-
244
-
245
-
246
-
247
-
248
-
249
-
250
-
251
-
252
-
253
-
254
-
255
-
256
-
257
-
258
-
259
-
260
-
261
-
262
-
263
-
264
-
265
-
266
-
267
-
268
-
269
-
270
-
271
-
272
-
273
-
274
-
275
 |
 |

PART II
DUKE ENERGY CORPORATION •DUKE ENERGY CAROLINAS, LLC •DUKE ENERGY OHIO, INC. •DUKE ENERGY INDIANA, INC.
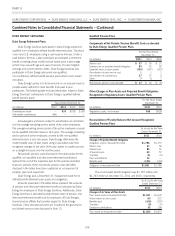
Combined Notes to Consolidated Financial Statements – (Continued)
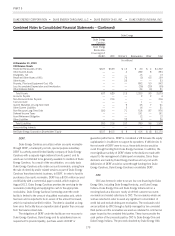
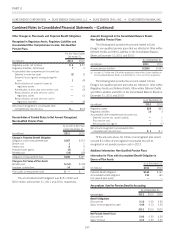
Stock Option Activity
Options
(in thousands)
Weighted-
Average
Exercise
Price
Weighted-
Average
Remaining
Life
(in years)
Aggregate
Intrinsic
Value
(in millions)
Outstanding at
December
31, 2010 13,881 $17
Granted 1,074 18
Exercised (4,734) 15
Forfeited or
expired (3,954) 22
Outstanding at
December 31,
2011 6,267 $15 4.6 $41
Exercisable at
December 31,
2011 4,256 $15 2.7 $31
Options
Expected to
Vest 2,011 $17 8.6 $10
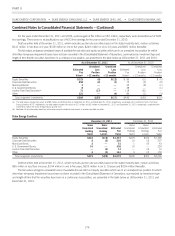
On December 31, 2010 and 2009, Duke Energy had
12 million and 17 million exercisable options, respectively with a
weighted-average exercise price of $17 and $18, respectively. The
options granted in 2011 were expensed immediately, therefore, there
is no future compensation cost associated with these options. The
following table includes information related to Duke Energy’s stock
options.
For the Years Ended
December 31,
(in millions) 2011 2010 2009
Intrinsic value of options exercised $26$8$6
Tax benefit related to options exercised 10 32
Cash received from options exercised 74 14 24
(in thousands of shares)
Stock options granted(a) 1,074 1,103 603
(a) The options granted in 2011 were expensed immediately, therefore, there is no future
compensation cost associated with these options.
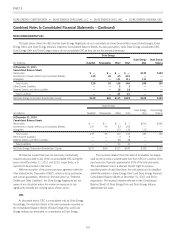
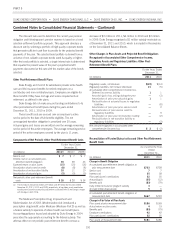
These assumptions were used to determine the grant date fair
value of the stock options granted during 2011:
Weighted-Average Assumptions for Option Pricing
Risk-free interest rate(a) 2.5%
Expected dividend yield(b) 5.7%
Expected life(c) 6.0 years
Expected volatility(d) 18.8%
(a) The risk free rate is based upon the U.S. Treasury Constant Maturity rates as of the
grant date.
(b) The expected dividend yield is based upon annualized dividends and the 1-year
average closing stock price.
(c) The expected life of options is derived from the simplified method approach.
(d) Volatility is based upon 50% historical and 50% implied volatility. Historic volatility is
based on Duke Energy’s historical volatility over the expected life using daily stock
prices. Implied volatility is the average for all option contracts with a term greater than
six months using the strike price closest to the stock price on the valuation date.
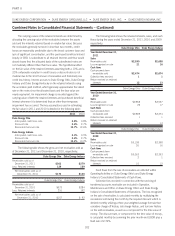
Phantom Stock Awards
Phantom stock awards issued and outstanding under the 2010
Plan and the 2006 Plan generally vest over periods from immediate
to three years. The following table includes information related to
Duke Energy’s phantom stock awards.
Shares awarded
(in thousands)
Fair value(a)
(in millions)
Years ended December 31,
2011 1,907 $34
2010 1,047 17
2009 1,096 16
(a) Based on the market price of Duke Energy’s common stock at the grant date.
The following table summarizes information about phantom
stock awards outstanding at December 31, 2011:
Shares
(in thousands)
Weighted Average
Per Share Grant
Date Fair Value
Number of Phantom Stock
Awards:
Outstanding at December 31,
2010 1,763 $17
Granted 1,907 18
Vested (1,057) 18
Forfeited (46) 18
Outstanding at December 31,
2011 2,567 $17
Phantom Stock Awards Expected
to Vest 2,503 $17
The total grant date fair value of the shares vested during the
years ended December 31, 2011, 2010 and 2009 was $19
million, $29 million and $23 million, respectively. At December 31,
2011, Duke Energy had $19 million of unrecognized compensation
cost which is expected to be recognized over a weighted-average
period of 2.6 years.
Performance Awards
Stock-based awards issued and outstanding under the 2010
Plan and the 2006 Plan generally vest over three years if
performance targets are met. Vesting for certain stock-based
performance awards can occur in three years, at the earliest, if
performance is met. Certain performance awards granted in 2011,
2010 and 2009 contain market conditions based on the total
shareholder return (TSR) of Duke Energy stock relative to a
pre-defined peer group (relative TSR). These awards are valued using
a path-dependent model that incorporates expected relative TSR into
the fair value determination of Duke Energy’s performance-based
share awards. The model uses three year historical volatilities and
correlations for all companies in the pre-defined peer group, including
186