Duke Energy 2011 Annual Report Download - page 196
Download and view the complete annual report
Please find page 196 of the 2011 Duke Energy annual report below. You can navigate through the pages in the report by either clicking on the pages listed below, or by using the keyword search tool below to find specific information within the annual report.-
 1
1 -
2
-
3
-
4
-
5
-
6
-
7
-
8
-
9
-
10
-
11
-
12
-
13
-
14
-
15
-
16
-
17
-
18
-
19
-
20
-
21
-
22
-
23
-
24
-
25
-
26
-
27
-
28
-
29
-
30
-
31
-
32
-
33
-
34
-
35
-
36
-
37
-
38
-
39
-
40
-
41
-
42
-
43
-
44
-
45
-
46
-
47
-
48
-
49
-
50
-
51
-
52
-
53
-
54
-
55
-
56
-
57
-
58
-
59
-
60
-
61
-
62
-
63
-
64
-
65
-
66
-
67
-
68
-
69
-
70
-
71
-
72
-
73
-
74
-
75
-
76
-
77
-
78
-
79
-
80
-
81
-
82
-
83
-
84
-
85
-
86
-
87
-
88
-
89
-
90
-
91
-
92
-
93
-
94
-
95
-
96
-
97
-
98
-
99
-
100
-
101
-
102
-
103
-
104
-
105
-
106
-
107
-
108
-
109
-
110
-
111
-
112
-
113
-
114
-
115
-
116
-
117
-
118
-
119
-
120
-
121
-
122
-
123
-
124
-
125
-
126
-
127
-
128
-
129
-
130
-
131
-
132
-
133
-
134
-
135
-
136
-
137
-
138
-
139
-
140
-
141
-
142
-
143
-
144
-
145
-
146
-
147
-
148
-
149
-
150
-
151
-
152
-
153
-
154
-
155
-
156
-
157
-
158
-
159
-
160
-
161
-
162
-
163
-
164
-
165
-
166
-
167
-
168
-
169
-
170
-
171
-
172
-
173
-
174
-
175
-
176
-
177
-
178
-
179
-
180
-
181
-
182
-
183
-
184
-
185
-
 186
186 -
 187
187 -
 188
188 -
 189
189 -
 190
190 -
 191
191 -
 192
192 -
 193
193 -
 194
194 -
 195
195 -
 196
196 -
 197
197 -
 198
198 -
 199
199 -
 200
200 -
 201
201 -
 202
202 -
 203
203 -
 204
204 -
 205
205 -
 206
206 -
207
-
208
-
209
-
210
-
211
-
212
-
213
-
214
-
215
-
216
-
217
-
218
-
219
-
220
-
221
-
222
-
223
-
224
-
225
-
226
-
227
-
228
-
229
-
230
-
231
-
232
-
233
-
234
-
235
-
236
-
237
-
238
-
239
-
240
-
241
-
242
-
243
-
244
-
245
-
246
-
247
-
248
-
249
-
250
-
251
-
252
-
253
-
254
-
255
-
256
-
257
-
258
-
259
-
260
-
261
-
262
-
263
-
264
-
265
-
266
-
267
-
268
-
269
-
270
-
271
-
272
-
273
-
274
-
275
 |
 |

PART II
DUKE ENERGY CORPORATION •DUKE ENERGY CAROLINAS, LLC •DUKE ENERGY OHIO, INC. •DUKE ENERGY INDIANA, INC.
Combined Notes to Consolidated Financial Statements – (Continued)
For the years ended December 31, 2011 and 2009, a pre-tax gain of $6 million and $7 million, respectively were reclassified out of AOCI
into earnings. There were no reclassifications out of AOCI into earnings for the year ended December 31, 2010.
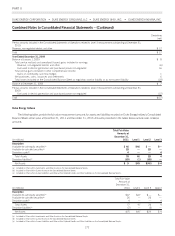
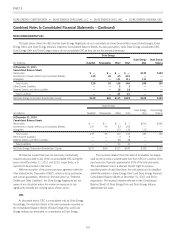
Debt securities held at December 31, 2011, which excludes auction rate securities based on the stated maturity date, mature as follows:
$141 million in less than one year, $318 million in one to five years, $240 million in six to 10 years and $381 million thereafter.
The fair values and gross unrealized losses of available-for-sale debt and equity securities which are in an unrealized loss position for which
other-than-temporary impairment losses have not been recorded in the Consolidated Statement of Operations, summarized by investment type and
length of time that the securities have been in a continuous loss position, are presented in the table below as of December 31, 2011 and 2010.
As of December 31, 2011 As of December 31, 2010
Estimated
Fair
Value(a)
Unrealized
Loss
Position
>12 months
Unrealized
Loss
Position
<12 months
Estimated
Fair
Value(a)
Unrealized
Loss
Position
>12 months
Unrealized
Loss
Position
<12 months
Equity Securities $123 (6) $(12) $ 85 (11) $ (5)
Corporate Debt Securities 258 (2) (1) 73 (2) (2)
Municipal Bonds 3——42 (8) (1)
U.S. Government Bonds 8——38 — (1)
Auction Rate Debt Securities(b) 71 (17) — 118 (31) —
Other 121 — (4) 84 (1) (3)
Total long-term investments $584 $(25) $(17) $440 $(53) $(12)
(a) The table above includes fair values of $289 million and $226 million at December 31, 2011 and December 31, 2010, respectively, associated with investments held in the Duke
Energy Carolinas NDTF. Additionally, the table above includes fair values of $11 million and $5 million at December 31, 2011 and December 31, 2010, respectively, associated with
investments held in the Duke Energy Indiana grantor trust.
(b) See Note 15 for information about fair value measurements related to investments in auction rate debt securities.
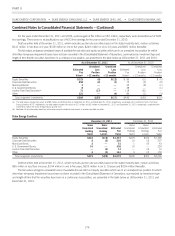
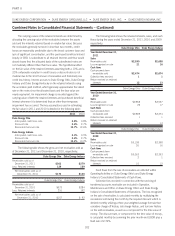
Duke Energy Carolinas
December 31, 2011 December 31, 2010
Gross
Unrealized
Holding
Gains
Gross
Unrealized
Holding
Losses
Estimated
Fair
Value
Gross
Unrealized
Holding
Gains
Gross
Unrealized
Holding
Losses
Estimated
Fair
Value
Equity Securities $443 $(16) $1,337 $475 $(16) $1,365
Corporate Debt Securities 8(2)20510 (3) 227
Municipal Bonds 2—51 1 (9) 43
U.S. Government Bonds 16 — 306 10 — 224
Auction Rate Debt Securities — (3) 12 — (3) 12
Other 4(4)161 9 (4) 155
Total long-term investments $473 $(25) $2,072 $505 $(35) $2,026
Debt securities held at December 31, 2011, which excludes auction rate securities based on the stated maturity date, mature as follows:
$65 million in less than one year, $144 million in one to five years, $205 million in six to 10 years and $309 million thereafter.
The fair values and gross unrealized losses of available-for-sale debt and equity securities which are in an unrealized loss position for which
other-than-temporary impairment losses have not been recorded in the Consolidated Statement of Operations, summarized by investment type
and length of time that the securities have been in a continuous loss position, are presented in the table below as of December 31, 2011 and
December 31, 2010.
176