Duke Energy 2011 Annual Report Download - page 190
Download and view the complete annual report
Please find page 190 of the 2011 Duke Energy annual report below. You can navigate through the pages in the report by either clicking on the pages listed below, or by using the keyword search tool below to find specific information within the annual report.-
 1
1 -
2
-
3
-
4
-
5
-
6
-
7
-
8
-
9
-
10
-
11
-
12
-
13
-
14
-
15
-
16
-
17
-
18
-
19
-
20
-
21
-
22
-
23
-
24
-
25
-
26
-
27
-
28
-
29
-
30
-
31
-
32
-
33
-
34
-
35
-
36
-
37
-
38
-
39
-
40
-
41
-
42
-
43
-
44
-
45
-
46
-
47
-
48
-
49
-
50
-
51
-
52
-
53
-
54
-
55
-
56
-
57
-
58
-
59
-
60
-
61
-
62
-
63
-
64
-
65
-
66
-
67
-
68
-
69
-
70
-
71
-
72
-
73
-
74
-
75
-
76
-
77
-
78
-
79
-
80
-
81
-
82
-
83
-
84
-
85
-
86
-
87
-
88
-
89
-
90
-
91
-
92
-
93
-
94
-
95
-
96
-
97
-
98
-
99
-
100
-
101
-
102
-
103
-
104
-
105
-
106
-
107
-
108
-
109
-
110
-
111
-
112
-
113
-
114
-
115
-
116
-
117
-
118
-
119
-
120
-
121
-
122
-
123
-
124
-
125
-
126
-
127
-
128
-
129
-
130
-
131
-
132
-
133
-
134
-
135
-
136
-
137
-
138
-
139
-
140
-
141
-
142
-
143
-
144
-
145
-
146
-
147
-
148
-
149
-
150
-
151
-
152
-
153
-
154
-
155
-
156
-
157
-
158
-
159
-
160
-
161
-
162
-
163
-
164
-
165
-
166
-
167
-
168
-
169
-
170
-
171
-
172
-
173
-
174
-
175
-
176
-
177
-
178
-
179
-
 180
180 -
 181
181 -
 182
182 -
 183
183 -
 184
184 -
 185
185 -
 186
186 -
 187
187 -
 188
188 -
 189
189 -
 190
190 -
 191
191 -
 192
192 -
 193
193 -
 194
194 -
 195
195 -
 196
196 -
 197
197 -
 198
198 -
 199
199 -
 200
200 -
201
-
202
-
203
-
204
-
205
-
206
-
207
-
208
-
209
-
210
-
211
-
212
-
213
-
214
-
215
-
216
-
217
-
218
-
219
-
220
-
221
-
222
-
223
-
224
-
225
-
226
-
227
-
228
-
229
-
230
-
231
-
232
-
233
-
234
-
235
-
236
-
237
-
238
-
239
-
240
-
241
-
242
-
243
-
244
-
245
-
246
-
247
-
248
-
249
-
250
-
251
-
252
-
253
-
254
-
255
-
256
-
257
-
258
-
259
-
260
-
261
-
262
-
263
-
264
-
265
-
266
-
267
-
268
-
269
-
270
-
271
-
272
-
273
-
274
-
275
 |
 |

PART II
DUKE ENERGY CORPORATION •DUKE ENERGY CAROLINAS, LLC •DUKE ENERGY OHIO, INC. •DUKE ENERGY INDIANA, INC.
Combined Notes to Consolidated Financial Statements – (Continued)
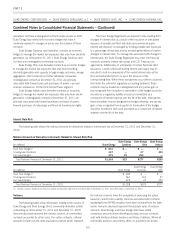
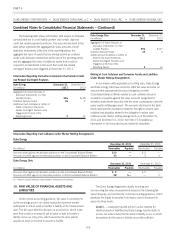
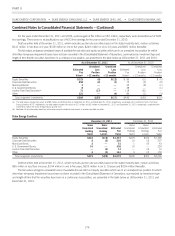
(in millions)
TotalFairValue
Amounts at
December 31,
2010 Level 1 Level 2 Level 3
Description
Investments in available-for-sale auction rate securities(a) $12$ — $— $12
Nuclear decommissioning trust fund equity securities 1,365 1,313 46 6
Nuclear decommissioning trust fund debt securities 649 35 573 41
Derivative assets(b) 62 1 61 —
Total assets 2,088 1,349 680 59
Derivative liabilities(c) (1) (1) — —
Net assets $2,087 $1,348 $680 $59
(a) Included in Other within Investments and Other Assets on the Consolidated Balance Sheets.
(b) Included in Other within Current Assets and Other within Investments and Other Assets on the Consolidated Balance Sheets.
(c) Included in Other within Current Liabilities and Other within Deferred Credits and Other Liabilities on the Consolidated Balance Sheets.
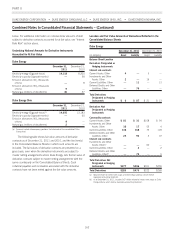
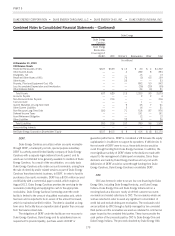
The following table provides a reconciliation of beginning and ending balances of assets measured at fair value on a recurring basis where
the determination of fair value includes significant unobservable inputs (Level 3):
Rollforward of Level 3 Measurements
(in millions)
Available-for- Sale
Auction Rate
Securities
Available-for-Sale
NDTF
Investments Total
Year Ended December 31, 2011
Balance at January 1, 2011 $12 $47 $59
Net purchases, sales, issuances and settlements:
Purchases —88
Sales (3) (3)
Total gains included on the Consolidated Balance Sheet as regulatory asset or liability —11
Balance at December 31, 2011 $12 $53 $65
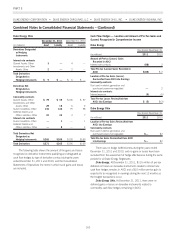
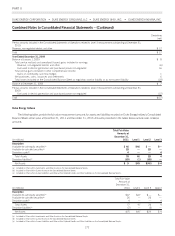
(in millions)
Available-for- Sale
Auction Rate
Securities
Available-for-Sale
NDTF
Investments Total
Year Ended December 31, 2010
Balance at January 1, 2010 $66 $— $66
Total pre-tax gains included in other comprehensive income:
Gains on available for sale securities and other 12 — 12
Net purchases, sales, issuances and settlements (66) 45 (21)
Total gains included on the Consolidated Balance Sheet as regulatory asset or liability — 2 2
Balance at December 31, 2010 $12 $47 $59
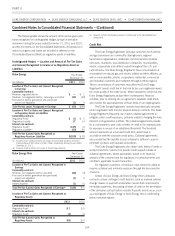
(in millions)
Available-for-Sale
Auction Rate
Securities
Year Ended December 31, 2009
Balance at January 1, 2009 $72
Total pre-tax unrealized losses included in Other Comprehensive income:
Losses on available for sale securities and other (6)
Balance at December 31, 2009 $66
170