Duke Energy 2011 Annual Report Download - page 215
Download and view the complete annual report
Please find page 215 of the 2011 Duke Energy annual report below. You can navigate through the pages in the report by either clicking on the pages listed below, or by using the keyword search tool below to find specific information within the annual report.-
 1
1 -
2
-
3
-
4
-
5
-
6
-
7
-
8
-
9
-
10
-
11
-
12
-
13
-
14
-
15
-
16
-
17
-
18
-
19
-
20
-
21
-
22
-
23
-
24
-
25
-
26
-
27
-
28
-
29
-
30
-
31
-
32
-
33
-
34
-
35
-
36
-
37
-
38
-
39
-
40
-
41
-
42
-
43
-
44
-
45
-
46
-
47
-
48
-
49
-
50
-
51
-
52
-
53
-
54
-
55
-
56
-
57
-
58
-
59
-
60
-
61
-
62
-
63
-
64
-
65
-
66
-
67
-
68
-
69
-
70
-
71
-
72
-
73
-
74
-
75
-
76
-
77
-
78
-
79
-
80
-
81
-
82
-
83
-
84
-
85
-
86
-
87
-
88
-
89
-
90
-
91
-
92
-
93
-
94
-
95
-
96
-
97
-
98
-
99
-
100
-
101
-
102
-
103
-
104
-
105
-
106
-
107
-
108
-
109
-
110
-
111
-
112
-
113
-
114
-
115
-
116
-
117
-
118
-
119
-
120
-
121
-
122
-
123
-
124
-
125
-
126
-
127
-
128
-
129
-
130
-
131
-
132
-
133
-
134
-
135
-
136
-
137
-
138
-
139
-
140
-
141
-
142
-
143
-
144
-
145
-
146
-
147
-
148
-
149
-
150
-
151
-
152
-
153
-
154
-
155
-
156
-
157
-
158
-
159
-
160
-
161
-
162
-
163
-
164
-
165
-
166
-
167
-
168
-
169
-
170
-
171
-
172
-
173
-
174
-
175
-
176
-
177
-
178
-
179
-
180
-
181
-
182
-
183
-
184
-
185
-
186
-
187
-
188
-
189
-
190
-
191
-
192
-
193
-
194
-
195
-
196
-
197
-
198
-
199
-
200
-
201
-
202
-
203
-
204
-
 205
205 -
 206
206 -
 207
207 -
 208
208 -
 209
209 -
 210
210 -
 211
211 -
 212
212 -
 213
213 -
 214
214 -
 215
215 -
 216
216 -
 217
217 -
 218
218 -
 219
219 -
 220
220 -
 221
221 -
 222
222 -
 223
223 -
 224
224 -
 225
225 -
226
-
227
-
228
-
229
-
230
-
231
-
232
-
233
-
234
-
235
-
236
-
237
-
238
-
239
-
240
-
241
-
242
-
243
-
244
-
245
-
246
-
247
-
248
-
249
-
250
-
251
-
252
-
253
-
254
-
255
-
256
-
257
-
258
-
259
-
260
-
261
-
262
-
263
-
264
-
265
-
266
-
267
-
268
-
269
-
270
-
271
-
272
-
273
-
274
-
275
 |
 |

PART II
DUKE ENERGY CORPORATION •DUKE ENERGY CAROLINAS, LLC •DUKE ENERGY OHIO, INC. •DUKE ENERGY INDIANA, INC.
Combined Notes to Consolidated Financial Statements – (Continued)
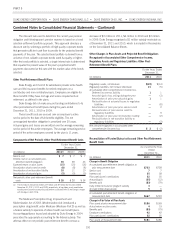
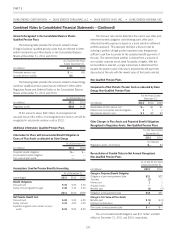
Thefollowingtableprovidesthefairvaluemeasurement
amounts for VEBA I other post-retirement assets at December 31,
2011:
(in millions)
Total Fair Value
Amounts at
December 31,
2011 Level 1 Level 2 Level 3
VEBA I
Cash and cash
equivalents $26 $— $26 $—
Equity securities 11 — 11 —
Debt securities 16 — 16 —
Total Assets $53 $— $53 $—
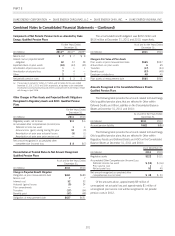
Thefollowingtableprovidesthefairvaluemeasurement
amounts for VEBA I and VEBA II other post-retirement assets at
December 31, 2010:
(in millions)
TotalFairValue
Amounts at
December 31,
2010 Level 1 Level 2 Level 3
VEBA I/II
Cash and cash
equivalents $30 $— $30 $—
Equity securities 12 — 12 —
Debt securities 17 — 17 —
Total Assets $59 $— $59 $—
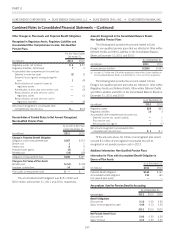
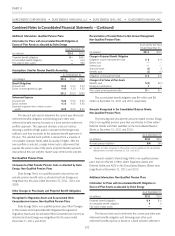
The following table provides a reconciliation of beginning and
ending balances of Master Trust assets measured at fair value on a
recurring basis where the determination of fair value includes
significant unobservable inputs (Level 3) for the year ended
December 31, 2011:
Year Ended December 31, 2011 (in millions)
Master Trust
Balance at January 1, 2011 $185
Purchases, sales, issuances and settlements:
Purchases 156
Sales (29)
Total gains (losses), (realized and unrealized) and other 10
Balance at December 31, 2011 $322
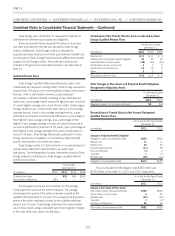
The following table provides a reconciliation of beginning and
ending balances of Master Trust assets measured at fair value on a
recurring basis where the determination of fair value includes
significant unobservable inputs (Level 3) for the year ended
December 31, 2010:
Year Ended December 31, 2010 (in millions)
Master Trust
Balance at January 1, 2010 $256
Purchases, sales, issuances and settlements (net) (71)
Total gains (losses), realized and unrealized and other —
Balance at December 31, 2010 $185
Valuation methods of the primary fair value measurements
disclosed above are as follows:
Investments in equity securities:
Investments in equity securities are typically valued at the
closing price in the principal active market as of the last business day
of the quarter. Principal active markets for equity prices include
published exchanges such as NASDAQ and NYSE. Foreign equity
prices are translated from their trading currency using the currency
exchange rate in effect at the close of the principal active market.
Duke Energy has not adjusted prices to reflect for after-hours market
activity. Most equity security valuations are Level 1 measures.
Investments in equity securities with unpublished prices are valued
as Level 2 if they are redeemable at the measurement date.
Investments in equity securities with redemption restrictions are
valued as Level 3.
Investments in corporate bonds and U.S. government securities:
Most debt investments are valued based on a calculation using
interest rate curves and credit spreads applied to the terms of the debt
instrument (maturity and coupon interest rate) and consider the
counterparty credit rating. Most debt valuations are Level 2 measures. If
the market for a particular fixed income security is relatively inactive or
illiquid, the measurement is a Level 3 measurement.
Investments in short-term investment funds:
Valued at the net asset value of units held at year end.
Investments in short-term investment funds with published prices are
valued as Level 1. Investments in short-term investment funds with
unpublished prices are valued as Level 2.
Investments in real estate investment trust:
Valued based upon property appraisal reports prepared by
independent real estate appraisers. The Chief Real Estate Appraiser of
the asset manager is responsible for assuring that the valuation
process provides independent and reasonable property market value
estimates. An external appraisal management firm not affiliated with
the asset manager has been appointed to assist the Chief Real Estate
Appraiser in maintaining and monitoring the independence and the
accuracy of the appraisal process.
Employee Savings Plans
Duke Energy sponsors employee savings plans that cover
substantially all U.S. employees. Most employees participate in a
matching contribution formula where Duke Energy provides a
matching contribution generally equal to 100% of employee
before-tax and Roth 401(k) contributions, of up to 6% of eligible pay
per pay period. Duke Energy made pre-tax employer matching
contributions of $86 million in 2011, $85 million in 2010 and $80
million in 2009. Dividends on Duke Energy shares held by the
savings plans are charged to retained earnings when declared and
shares held in the plans are considered outstanding in the calculation
of basic and diluted earnings per share.
195