Duke Energy 2011 Annual Report Download - page 59
Download and view the complete annual report
Please find page 59 of the 2011 Duke Energy annual report below. You can navigate through the pages in the report by either clicking on the pages listed below, or by using the keyword search tool below to find specific information within the annual report.-
 1
1 -
2
-
3
-
4
-
5
-
6
-
7
-
8
-
9
-
10
-
11
-
12
-
13
-
14
-
15
-
16
-
17
-
18
-
19
-
20
-
21
-
22
-
23
-
24
-
25
-
26
-
27
-
28
-
29
-
30
-
31
-
32
-
33
-
34
-
35
-
36
-
37
-
38
-
39
-
40
-
41
-
42
-
43
-
44
-
45
-
46
-
47
-
48
-
 49
49 -
 50
50 -
 51
51 -
 52
52 -
 53
53 -
 54
54 -
 55
55 -
 56
56 -
 57
57 -
 58
58 -
 59
59 -
 60
60 -
 61
61 -
 62
62 -
 63
63 -
 64
64 -
 65
65 -
 66
66 -
 67
67 -
 68
68 -
 69
69 -
70
-
71
-
72
-
73
-
74
-
75
-
76
-
77
-
78
-
79
-
80
-
81
-
82
-
83
-
84
-
85
-
86
-
87
-
88
-
89
-
90
-
91
-
92
-
93
-
94
-
95
-
96
-
97
-
98
-
99
-
100
-
101
-
102
-
103
-
104
-
105
-
106
-
107
-
108
-
109
-
110
-
111
-
112
-
113
-
114
-
115
-
116
-
117
-
118
-
119
-
120
-
121
-
122
-
123
-
124
-
125
-
126
-
127
-
128
-
129
-
130
-
131
-
132
-
133
-
134
-
135
-
136
-
137
-
138
-
139
-
140
-
141
-
142
-
143
-
144
-
145
-
146
-
147
-
148
-
149
-
150
-
151
-
152
-
153
-
154
-
155
-
156
-
157
-
158
-
159
-
160
-
161
-
162
-
163
-
164
-
165
-
166
-
167
-
168
-
169
-
170
-
171
-
172
-
173
-
174
-
175
-
176
-
177
-
178
-
179
-
180
-
181
-
182
-
183
-
184
-
185
-
186
-
187
-
188
-
189
-
190
-
191
-
192
-
193
-
194
-
195
-
196
-
197
-
198
-
199
-
200
-
201
-
202
-
203
-
204
-
205
-
206
-
207
-
208
-
209
-
210
-
211
-
212
-
213
-
214
-
215
-
216
-
217
-
218
-
219
-
220
-
221
-
222
-
223
-
224
-
225
-
226
-
227
-
228
-
229
-
230
-
231
-
232
-
233
-
234
-
235
-
236
-
237
-
238
-
239
-
240
-
241
-
242
-
243
-
244
-
245
-
246
-
247
-
248
-
249
-
250
-
251
-
252
-
253
-
254
-
255
-
256
-
257
-
258
-
259
-
260
-
261
-
262
-
263
-
264
-
265
-
266
-
267
-
268
-
269
-
270
-
271
-
272
-
273
-
274
-
275
 |
 |

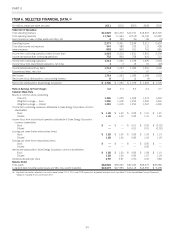
PART II
Achieving Adjusted Diluted Earnings Target and Growing
Annual Dividends. Duke Energy’s adjusted diluted earnings per share
outlook range for 2012 is $1.40 to $1.45. Attainment of this range
will be a key factor in achieving Duke Energy’s targeted 4-6% long-
term adjusted earnings growth plan from a base of 2009. Refer to the
section “Results of Operations” for the definition of adjusted earnings,
a non-GAAP financial measure. Duke Energy expects its 2012
financial results as compared to 2011 to be impacted by the items
discussed below.
Positive earnings drivers for 2012 are expected to include:
• Increased earnings from ongoing modernization program and
2011 rate cases; and
• Increased weather-normalized retail load growth.
Negative earnings drivers for 2012 are expected to include:
• An assumed return to normal weather in 2012 compared to
favorable weather experienced in 2011,
• The impact of the new ESP on Ohio coal-fired generation
operations,
• Lower results from Midwest Gas assets as a result of lower
PJM capacity prices; and
• The impact of potentially unfavorable exchange rates for
foreign operations.
Economic Factors for Duke Energy’s Business.
The historical and future trends of Duke Energy’s operating
results have been and will be affected in varying degrees by a
number of factors, including those discussed below. Duke Energy’s
revenues depend on customer usage, which varies with weather
conditions and behavior patterns, general business conditions and
the cost of energy services. Various regulatory agencies approve the
prices for electric service within their respective jurisdictions and affect
Duke Energy’s ability to recover its costs from customers.
Declines in demand for electricity as a result of economic
downturns reduce overall electricity sales and have the potential to
lessen Duke Energy’s cash flows, especially if retail customers reduce
consumption of electricity. A weakening economy could also impact
Duke Energy’s customers’ ability to pay, causing increased
delinquencies, slowing collections and leading to higher than normal
levels of accounts receivables, bad debts and financing requirements.
A portion of USFE&G’s business risk is mitigated by its regulated
allowable rates of return and recovery of fuel costs under fuel
adjustment clauses.
Duke Energy’s business model provides diversification between
relatively stable regulated businesses like those in USFE&G, and the
commodity cyclical and contracted businesses like Commercial
Power and International Energy. Duke Energy’s businesses can be
negatively affected by sustained downturns or sluggishness in the
economy. Market prices of commodities, which are beyond Duke
Energy’s control, could have a significant positive or negative impact
on the achievement of Duke Energy’s goals for 2012 and beyond.
If negative market conditions should persist over time and
estimated cash flows over the lives of Duke Energy’s individual
assets, including goodwill, do not exceed the carrying value of those
individual assets, asset impairments may occur in the future under
existing accounting rules and diminish results of operations. A change
in management’s intent about the use of individual assets (held for
use versus held for sale) could also result in impairments or losses.
Duke Energy evaluates the carrying amount of its recorded goodwill
for impairment on an annual basis as of August 31 and performs
interim impairment tests if a triggering event occurs that indicates it is
not more likely than not that the fair value of a reporting unit is less
than its carrying value. For further information on key assumptions
that impact Duke Energy’s goodwill impairment assessments, see
“Critical Accounting Policy for Goodwill Impairment Assessments”
and Note 12 to the Consolidated Financial Statements, “Goodwill,
Intangible Assets and Impairments.”
Duke Energy’s goals for 2012 and beyond could also be
substantially at risk due to the regulation of its businesses. Duke
Energy’s businesses in the U.S. are subject to regulation on the federal
and state level. Regulations, applicable to the electric power industry,
have a significant impact on the nature of the businesses and the
manner in which they operate. Duke Energy plans to file various rate
cases with several state regulatory agencies during 2012. New
legislation and changes to regulations are ongoing, including
anticipated carbon legislation, and Duke Energy cannot predict the
future course of changes in the regulatory or political environment or the
ultimate effect that any such future changes will have on its business.
Results of USFE&G are also impacted by the completion of its
major generation fleet modernization projects. Duke Energy makes
substantial investments in power plant upgrades and to maintain the
reliability of the energy transmission and distribution system.
Regulatory approval is needed to recover the costs of these
investments, which are expected to provide a significant cash flow to
enable recovery of costs incurred on a timely basis. Duke Energy
Indiana is 97% complete with the Edwardsport IGCC power plant,
which is expected to be in-service in 2012. Updates to the cost
estimate have led Duke Energy Indiana to filing a proposed cap on
the projects construction costs (excluding financing costs) which can
be recovered through rates at $2.72 billion. As a result, Duke Energy
Indiana has recorded pre-tax charges to earnings of $222 million in
the third quarter of 2011 and $44 million in the third quarter of
2010 to reflect the impact of cost over-runs. Updates to the cost
estimate could occur through the completion of the plant. Duke
Energy Indiana is awaiting an order from the Indiana Utility
Regulatory Commission (IURC) regarding the cost estimate increase
and the allegations of fraud, concealment and gross mismanagement
related to the IGCC project. See Note 4 to the Consolidated Financial
Statements, “Regulatory Matters,” for further discussion of the
significant increase in the estimated cost of the 618 MW
Edwardsport IGCC plant.
Duke Energy’s earnings are impacted by fluctuations in
commodity prices. Exposure to commodity prices generates higher
earnings volatility in the unregulated businesses. To mitigate these
risks, Duke Energy enters into derivative instruments to effectively
hedge some, but not all, known exposures.
Additionally, Duke Energy’s investments and projects located
outside of the U.S. expose Duke Energy to risks related to laws of
other countries, taxes, economic conditions, fluctuations in currency
39