Duke Energy 2011 Annual Report Download - page 18
Download and view the complete annual report
Please find page 18 of the 2011 Duke Energy annual report below. You can navigate through the pages in the report by either clicking on the pages listed below, or by using the keyword search tool below to find specific information within the annual report.-
 1
1 -
2
-
3
-
4
-
5
-
6
-
7
-
 8
8 -
 9
9 -
 10
10 -
 11
11 -
 12
12 -
 13
13 -
 14
14 -
 15
15 -
 16
16 -
 17
17 -
 18
18 -
 19
19 -
 20
20 -
 21
21 -
 22
22 -
 23
23 -
 24
24 -
 25
25 -
 26
26 -
 27
27 -
 28
28 -
29
-
30
-
31
-
32
-
33
-
34
-
35
-
36
-
37
-
38
-
39
-
40
-
41
-
42
-
43
-
44
-
45
-
46
-
47
-
48
-
49
-
50
-
51
-
52
-
53
-
54
-
55
-
56
-
57
-
58
-
59
-
60
-
61
-
62
-
63
-
64
-
65
-
66
-
67
-
68
-
69
-
70
-
71
-
72
-
73
-
74
-
75
-
76
-
77
-
78
-
79
-
80
-
81
-
82
-
83
-
84
-
85
-
86
-
87
-
88
-
89
-
90
-
91
-
92
-
93
-
94
-
95
-
96
-
97
-
98
-
99
-
100
-
101
-
102
-
103
-
104
-
105
-
106
-
107
-
108
-
109
-
110
-
111
-
112
-
113
-
114
-
115
-
116
-
117
-
118
-
119
-
120
-
121
-
122
-
123
-
124
-
125
-
126
-
127
-
128
-
129
-
130
-
131
-
132
-
133
-
134
-
135
-
136
-
137
-
138
-
139
-
140
-
141
-
142
-
143
-
144
-
145
-
146
-
147
-
148
-
149
-
150
-
151
-
152
-
153
-
154
-
155
-
156
-
157
-
158
-
159
-
160
-
161
-
162
-
163
-
164
-
165
-
166
-
167
-
168
-
169
-
170
-
171
-
172
-
173
-
174
-
175
-
176
-
177
-
178
-
179
-
180
-
181
-
182
-
183
-
184
-
185
-
186
-
187
-
188
-
189
-
190
-
191
-
192
-
193
-
194
-
195
-
196
-
197
-
198
-
199
-
200
-
201
-
202
-
203
-
204
-
205
-
206
-
207
-
208
-
209
-
210
-
211
-
212
-
213
-
214
-
215
-
216
-
217
-
218
-
219
-
220
-
221
-
222
-
223
-
224
-
225
-
226
-
227
-
228
-
229
-
230
-
231
-
232
-
233
-
234
-
235
-
236
-
237
-
238
-
239
-
240
-
241
-
242
-
243
-
244
-
245
-
246
-
247
-
248
-
249
-
250
-
251
-
252
-
253
-
254
-
255
-
256
-
257
-
258
-
259
-
260
-
261
-
262
-
263
-
264
-
265
-
266
-
267
-
268
-
269
-
270
-
271
-
272
-
273
-
274
-
275
 |
 |

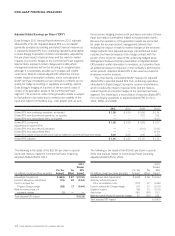
The following is a reconciliation of adjusted segment EBIT for the year ended December 31, 2011, to the most directly comparable
GAAP measure:
For the Year Ended December 31, 2011
Economic
Adjusted Emission Hedges Reported
Segment Edwardsport Allowances (Mark-to- Segment
(In millions) EBIT Impairment Impairment Market) EBIT
U.S. Franchised Electric & Gas $ 2,826 $ (222) $ — $ — $ 2,604
Commercial Power 305 — (79) (1) 225
International Energy 679 — — — 679
Total 2011 reportable segment EBIT $ 3,810 $ (222) $ (79) $ (1) $ 3,508
Effective with the first quarter of 2012, Duke Energy will
no longer report EBIT for its business segments. Instead,
Duke Energy will begin evaluating the performance of its
segments on a net income basis. This new reporting measure
will involve an allocation of interest and taxes as well as
previously unallocated corporate costs to each of the segments.
Other will primarily include captive insurance results and interest
expense on the direct debt of the Duke Energy holding company.
When used for future periods, segment and Other net income
may also include amounts that are ultimately reported as
discontinued operations. Due to the forward-looking nature of this
non-GAAP financial measure for 2012, information to reconcile it
to the most directly comparable GAAP financial measure is not
available at this time, as management is unable to project special
items or mark-to-market adjustments for future periods.
Dividend Payout Ratio
Duke Energy’s 2011 Annual Report includes a discussion
of Duke Energy’s anticipated long-term dividend payout ratio
of 65-70% based upon adjusted diluted EPS. This payout
ratio is a non-GAAP financial measure as it is based upon
forecasted diluted EPS from continuing operations attributable
to Duke Energy Corporation shareholders, adjusted for the
per-share impact of special items and the mark-to-market
impacts of economic hedges in the Commercial Power segment,
as discussed above under “Adjusted Diluted Earnings Per Share
(“EPS”)”. The most directly comparable GAAP measure for
adjusted diluted EPS is reported diluted EPS from continuing
operations attributable to Duke Energy Corporation common
shareholders, which includes the impact of special items and the
mark-to-market impacts of economic hedges in the Commercial
Power segment. Due to the forward-looking nature of this
non-GAAP financial measure for future periods, information to
reconcile it to the most directly comparable GAAP financial
measure is not available at this time, as management is unable
to project special items or mark-to-market adjustments for
future periods.
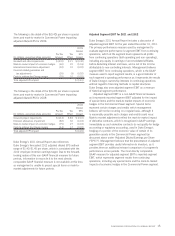
Total Available Liquidity
Duke Energy’s 2011 Annual Report includes a discussion of
total available liquidity. Total available liquidity is a non-GAAP
financial measure as it represents cash and cash equivalents
and short-term investments (excluding amounts held in foreign
jurisdictions) and remaining availability under the master credit
and regional bank credit facilities. The most directly comparable
GAAP financial measure for available liquidity is cash and cash
equivalents. The following is a reconciliation of total available
liquidity as of December 31, 2011 and December 31, 2010, to
the most directly comparable GAAP measure:
As of As of
December 31, December 31,
(In millions) 2011 2010
Cash and cash equivalents $ 2,110 $ 1,670
Short-term investments 190 —
Less: Amounts held in
foreign jurisdictions (1,037) (724)
1,263 946
Plus: Remaining availability
under master credit and
regional bank credit facilities 3,255 2,482
Total available liquidity $ 4,518 $ 3,428
16 DUKE ENERGY CORPORATION 2011 ANNUAL REPORT