Duke Energy 2011 Annual Report Download - page 185
Download and view the complete annual report
Please find page 185 of the 2011 Duke Energy annual report below. You can navigate through the pages in the report by either clicking on the pages listed below, or by using the keyword search tool below to find specific information within the annual report.-
 1
1 -
2
-
3
-
4
-
5
-
6
-
7
-
8
-
9
-
10
-
11
-
12
-
13
-
14
-
15
-
16
-
17
-
18
-
19
-
20
-
21
-
22
-
23
-
24
-
25
-
26
-
27
-
28
-
29
-
30
-
31
-
32
-
33
-
34
-
35
-
36
-
37
-
38
-
39
-
40
-
41
-
42
-
43
-
44
-
45
-
46
-
47
-
48
-
49
-
50
-
51
-
52
-
53
-
54
-
55
-
56
-
57
-
58
-
59
-
60
-
61
-
62
-
63
-
64
-
65
-
66
-
67
-
68
-
69
-
70
-
71
-
72
-
73
-
74
-
75
-
76
-
77
-
78
-
79
-
80
-
81
-
82
-
83
-
84
-
85
-
86
-
87
-
88
-
89
-
90
-
91
-
92
-
93
-
94
-
95
-
96
-
97
-
98
-
99
-
100
-
101
-
102
-
103
-
104
-
105
-
106
-
107
-
108
-
109
-
110
-
111
-
112
-
113
-
114
-
115
-
116
-
117
-
118
-
119
-
120
-
121
-
122
-
123
-
124
-
125
-
126
-
127
-
128
-
129
-
130
-
131
-
132
-
133
-
134
-
135
-
136
-
137
-
138
-
139
-
140
-
141
-
142
-
143
-
144
-
145
-
146
-
147
-
148
-
149
-
150
-
151
-
152
-
153
-
154
-
155
-
156
-
157
-
158
-
159
-
160
-
161
-
162
-
163
-
164
-
165
-
166
-
167
-
168
-
169
-
170
-
171
-
172
-
173
-
174
-
 175
175 -
 176
176 -
 177
177 -
 178
178 -
 179
179 -
 180
180 -
 181
181 -
 182
182 -
 183
183 -
 184
184 -
 185
185 -
 186
186 -
 187
187 -
 188
188 -
 189
189 -
 190
190 -
 191
191 -
 192
192 -
 193
193 -
 194
194 -
 195
195 -
196
-
197
-
198
-
199
-
200
-
201
-
202
-
203
-
204
-
205
-
206
-
207
-
208
-
209
-
210
-
211
-
212
-
213
-
214
-
215
-
216
-
217
-
218
-
219
-
220
-
221
-
222
-
223
-
224
-
225
-
226
-
227
-
228
-
229
-
230
-
231
-
232
-
233
-
234
-
235
-
236
-
237
-
238
-
239
-
240
-
241
-
242
-
243
-
244
-
245
-
246
-
247
-
248
-
249
-
250
-
251
-
252
-
253
-
254
-
255
-
256
-
257
-
258
-
259
-
260
-
261
-
262
-
263
-
264
-
265
-
266
-
267
-
268
-
269
-
270
-
271
-
272
-
273
-
274
-
275
 |
 |

PART II
DUKE ENERGY CORPORATION •DUKE ENERGY CAROLINAS, LLC •DUKE ENERGY OHIO, INC. •DUKE ENERGY INDIANA, INC.
Combined Notes to Consolidated Financial Statements – (Continued)
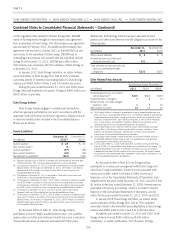
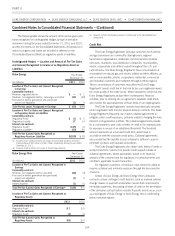
The following table shows information with respect to derivative
contracts that are in a net liability position and contain objective
credit-risk related payment provisions. The amounts disclosed in the
table below represents the aggregate fair value amounts of such
derivative instruments at the end of the reporting period, the
aggregate fair value of assets that are already posted as collateral
under such derivative instruments at the end of the reporting period,
and the aggregate fair value of additional assets that would be
required to be transferred in the event that credit-risk-related
contingent features were triggered at December 31, 2011.
Information Regarding Derivative Instruments that Contain Credit-
risk Related Contingent Features
Duke Energy
(in millions)
December 31,
2011
December 31,
2010
Aggregate Fair Value Amounts of
Derivative Instruments in a Net
Liability Position $96 $148
Collateral Already Posted 36 2
Additional Cash Collateral or Letters of
Credit in the Event Credit-risk-
related Contingent Features were
Triggered at the End of the
Reporting Period 514
Duke Energy Ohio
(in millions)
December 31,
2011
December 31,
2010
Aggregate Fair Value Amounts of
Derivative Instruments in a Net
Liability Position $94 $147
Collateral Already Posted 35 2
Additional Cash Collateral or Letters of
Credit in the Event Credit-risk-
related Contingent Features were
Triggered at the End of the
Reporting Period 514
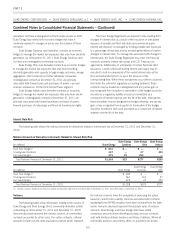
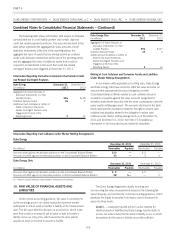
Netting of Cash Collateral and Derivative Assets and Liabilities
Under Master Netting Arrangements.
In accordance with applicable accounting rules, Duke Energy
and Duke Energy Ohio have elected to offset fair value amounts (or
amounts that approximate fair value) recognized on their
Consolidated Balance Sheets related to cash collateral amounts
receivable or payable against fair value amounts recognized for
derivative instruments executed with the same counterparty under the
same master netting agreement. The amounts disclosed in the table
below represent the receivables related to the right to reclaim cash
collateral and payables related to the obligation to return cash
collateral under master netting arrangements as of December 31,
2011 and December 31, 2010. See Note 15 for additional
information on fair value disclosures related to derivatives.
Information Regarding Cash Collateral under Master Netting Arrangements
Duke Energy
December 31, 2011 December 31, 2010
(in millions) Receivables Payables Receivables Payables
Amounts offset against net derivative positions on the Consolidated Balance Sheets $10 — $2 —
Amounts not offset against net derivative positions on the Consolidated Balance Sheets(a) 30 — 23
Duke Energy Ohio
December 31, 2011 December 31, 2010
(in millions) Receivables Payables Receivables Payables
Amounts offset against net derivative positions on the Consolidated Balance Sheets $9 — $2 —
Amounts not offset against net derivative positions on the Consolidated Balance Sheets(a) 28 $— —3
(a) Amounts primarily represent margin deposits related to futures contracts.
15. FAIR VALUE OF FINANCIAL ASSETS AND
LIABILITIES
Under current accounting guidance, fair value is considered to
be the exchange price in an orderly transaction between market
participants to sell an asset or transfer a liability at the measurement
date. The fair value definition focuses on an exit price, which is the
price that would be received to sell an asset or paid to transfer a
liability versus an entry price, which would be the price paid to
acquire an asset or received to assume a liability.
The Duke Energy Registrants classify recurring and
non-recurring fair value measurements based on the following fair
value hierarchy, as prescribed by current accounting guidance, which
prioritizes the inputs to valuation techniques used to measure fair
value into three levels:
Level 1 — unadjusted quoted prices in active markets for
identical assets or liabilities that Duke Energy has the ability to
access. An active market for the asset or liability is one in which
transactions for the asset or liability occur with sufficient
165