Duke Energy 2011 Annual Report Download - page 224
Download and view the complete annual report
Please find page 224 of the 2011 Duke Energy annual report below. You can navigate through the pages in the report by either clicking on the pages listed below, or by using the keyword search tool below to find specific information within the annual report.-
 1
1 -
2
-
3
-
4
-
5
-
6
-
7
-
8
-
9
-
10
-
11
-
12
-
13
-
14
-
15
-
16
-
17
-
18
-
19
-
20
-
21
-
22
-
23
-
24
-
25
-
26
-
27
-
28
-
29
-
30
-
31
-
32
-
33
-
34
-
35
-
36
-
37
-
38
-
39
-
40
-
41
-
42
-
43
-
44
-
45
-
46
-
47
-
48
-
49
-
50
-
51
-
52
-
53
-
54
-
55
-
56
-
57
-
58
-
59
-
60
-
61
-
62
-
63
-
64
-
65
-
66
-
67
-
68
-
69
-
70
-
71
-
72
-
73
-
74
-
75
-
76
-
77
-
78
-
79
-
80
-
81
-
82
-
83
-
84
-
85
-
86
-
87
-
88
-
89
-
90
-
91
-
92
-
93
-
94
-
95
-
96
-
97
-
98
-
99
-
100
-
101
-
102
-
103
-
104
-
105
-
106
-
107
-
108
-
109
-
110
-
111
-
112
-
113
-
114
-
115
-
116
-
117
-
118
-
119
-
120
-
121
-
122
-
123
-
124
-
125
-
126
-
127
-
128
-
129
-
130
-
131
-
132
-
133
-
134
-
135
-
136
-
137
-
138
-
139
-
140
-
141
-
142
-
143
-
144
-
145
-
146
-
147
-
148
-
149
-
150
-
151
-
152
-
153
-
154
-
155
-
156
-
157
-
158
-
159
-
160
-
161
-
162
-
163
-
164
-
165
-
166
-
167
-
168
-
169
-
170
-
171
-
172
-
173
-
174
-
175
-
176
-
177
-
178
-
179
-
180
-
181
-
182
-
183
-
184
-
185
-
186
-
187
-
188
-
189
-
190
-
191
-
192
-
193
-
194
-
195
-
196
-
197
-
198
-
199
-
200
-
201
-
202
-
203
-
204
-
205
-
206
-
207
-
208
-
209
-
210
-
211
-
212
-
213
-
 214
214 -
 215
215 -
 216
216 -
 217
217 -
 218
218 -
 219
219 -
 220
220 -
 221
221 -
 222
222 -
 223
223 -
 224
224 -
 225
225 -
 226
226 -
 227
227 -
 228
228 -
 229
229 -
 230
230 -
 231
231 -
 232
232 -
 233
233 -
 234
234 -
235
-
236
-
237
-
238
-
239
-
240
-
241
-
242
-
243
-
244
-
245
-
246
-
247
-
248
-
249
-
250
-
251
-
252
-
253
-
254
-
255
-
256
-
257
-
258
-
259
-
260
-
261
-
262
-
263
-
264
-
265
-
266
-
267
-
268
-
269
-
270
-
271
-
272
-
273
-
274
-
275
 |
 |

PART II
DUKE ENERGY CORPORATION •DUKE ENERGY CAROLINAS, LLC •DUKE ENERGY OHIO, INC. •DUKE ENERGY INDIANA, INC.
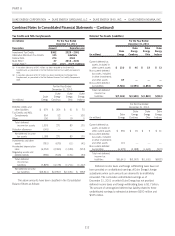
Combined Notes to Consolidated Financial Statements – (Continued)
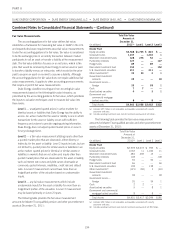
Amounts Recognized in the Consolidated Balance Sheets: Other
Post-Retirement Benefit Plans
The following table provides the amounts related to Duke Energy
Ohio’s other post-retirement benefit plans that are reflected in Other
within Deferred Credits and Other Liabilities on the Consolidated
Balance Sheets at December 31, 2011 and 2010:
As of December 31,
(in millions) 2011 2010
Accrued other post-retirement liability(a) $(52) $(58)
(a) Includes $2 million recognized in Other within Current Liabilities on the Consolidated
Balance Sheets as of both December 31, 2011 and 2010.
The following table provides the amounts related to Duke Energy
Ohio’s other post-retirement benefit plans that are reflected in Other
within Deferred Credits and Other Liabilities and AOCI on the
Consolidated Balance Sheets at December 31, 2011 and 2010:
As of December 31,
(in millions) 2011 2010
Regulatory liabilities $19 $20
Accumulated other comprehensive income
Deferred income tax liability $4 $5
Prior service credit (1) (1)
Net actuarial loss gain (9) (12)
Net amount recognized in accumulated other
comprehensive (income)/loss $(6) $(8)
Of the amounts above, $2 million of unrecognized gains and $1
million of unrecognized prior service credit (which will reduce pension
expense) will be recognized in net periodic pension costs in 2012.
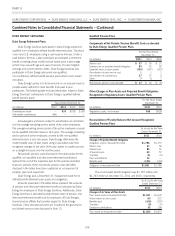
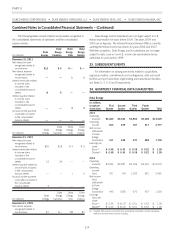
Assumptions Used for Other Post-retirement Benefits
Accounting
(percentages) 2011 2010 2009
Benefit Obligations
Discount rate 5.10 5.00 5.50
Net Periodic Benefit Cost
Discount rate 5.00 5.50 6.50
Expected long-term rate of return on plan
assets 8.25 8.50 8.50
Assumed Health Care Cost Trend Rate
2011 2010
Health care cost trend rate assumed for next year 8.75% 8.50%
Rate to which the cost trend is assumed to decline (the
ultimate trend rate) 5.00% 5.00%
Year that the rate reaches the ultimate trend rate 2020 2020
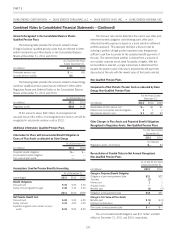
Sensitivity to Changes in Assumed Health Care Cost Trend Rates
(in millions)
1-Percentage-
Point Increase
1-Percentage-
Point Decrease
Effect on total service and interest
costs $ 1 $ (1)
Effect on post-retirement benefit
obligation 18 (16)
Expected Benefit Payments
The following table presents Duke Energy’s expected benefit
payments made on behalf of Duke Energy Ohio to participants in its
qualified, non-qualified and other post-retirement benefit plans over
the next 10 years, which are primarily paid out of the assets of the
various trusts. These benefit payments reflect expected future service,
as appropriate.
(in millions)
Qualified
Plans
Non-Qualified
Plans
Other Post-
Retirement
Plans Total
Years Ended December 31,
2012 $ 46 $1 $ 5 $ 52
2013 45 1 5 51
2014 44 1 6 51
2015 43 1 6 50
2016 44 1 6 51
2017 – 2021 241 3 27 271
Employee Savings Plans
Duke Energy sponsors, and Duke Energy Ohio participates in,
an employee savings plan that covers substantially all U.S.
employees. Duke Energy contributes a matching contribution equal to
100% of employee before-tax and Roth 401(k) employee
contributions, of up to 6% of eligible pay per period. Duke Energy
Ohio expensed pre-tax plan contributions, as allocated by Duke
Energy, of $4 million in 2011, $4 million in 2010 and $4 million in
2009.
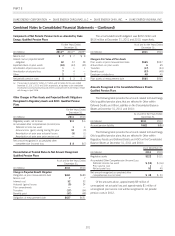
DUKE ENERGY INDIANA
Duke Energy Retirement Plans.
Duke Energy Indiana participates in qualified and non-qualified
defined benefit pension plans and other post-retirement benefit plans
sponsored by Duke Energy. Duke Energy allocates pension and other
post-retirement obligations and costs related to these plans to Duke
Energy Indiana.
Net periodic benefit cost disclosed below for the qualified,
non-qualified and other post-retirement benefit plans represent the
cost of the respective plan for the periods presented. However,
portions of the net periodic costs disclosed have been capitalized as a
component of property, plant and equipment.
204