Duke Energy 2011 Annual Report Download - page 122
Download and view the complete annual report
Please find page 122 of the 2011 Duke Energy annual report below. You can navigate through the pages in the report by either clicking on the pages listed below, or by using the keyword search tool below to find specific information within the annual report.-
 1
1 -
2
-
3
-
4
-
5
-
6
-
7
-
8
-
9
-
10
-
11
-
12
-
13
-
14
-
15
-
16
-
17
-
18
-
19
-
20
-
21
-
22
-
23
-
24
-
25
-
26
-
27
-
28
-
29
-
30
-
31
-
32
-
33
-
34
-
35
-
36
-
37
-
38
-
39
-
40
-
41
-
42
-
43
-
44
-
45
-
46
-
47
-
48
-
49
-
50
-
51
-
52
-
53
-
54
-
55
-
56
-
57
-
58
-
59
-
60
-
61
-
62
-
63
-
64
-
65
-
66
-
67
-
68
-
69
-
70
-
71
-
72
-
73
-
74
-
75
-
76
-
77
-
78
-
79
-
80
-
81
-
82
-
83
-
84
-
85
-
86
-
87
-
88
-
89
-
90
-
91
-
92
-
93
-
94
-
95
-
96
-
97
-
98
-
99
-
100
-
101
-
102
-
103
-
104
-
105
-
106
-
107
-
108
-
109
-
110
-
111
-
 112
112 -
 113
113 -
 114
114 -
 115
115 -
 116
116 -
 117
117 -
 118
118 -
 119
119 -
 120
120 -
 121
121 -
 122
122 -
 123
123 -
 124
124 -
 125
125 -
 126
126 -
 127
127 -
 128
128 -
 129
129 -
 130
130 -
 131
131 -
 132
132 -
133
-
134
-
135
-
136
-
137
-
138
-
139
-
140
-
141
-
142
-
143
-
144
-
145
-
146
-
147
-
148
-
149
-
150
-
151
-
152
-
153
-
154
-
155
-
156
-
157
-
158
-
159
-
160
-
161
-
162
-
163
-
164
-
165
-
166
-
167
-
168
-
169
-
170
-
171
-
172
-
173
-
174
-
175
-
176
-
177
-
178
-
179
-
180
-
181
-
182
-
183
-
184
-
185
-
186
-
187
-
188
-
189
-
190
-
191
-
192
-
193
-
194
-
195
-
196
-
197
-
198
-
199
-
200
-
201
-
202
-
203
-
204
-
205
-
206
-
207
-
208
-
209
-
210
-
211
-
212
-
213
-
214
-
215
-
216
-
217
-
218
-
219
-
220
-
221
-
222
-
223
-
224
-
225
-
226
-
227
-
228
-
229
-
230
-
231
-
232
-
233
-
234
-
235
-
236
-
237
-
238
-
239
-
240
-
241
-
242
-
243
-
244
-
245
-
246
-
247
-
248
-
249
-
250
-
251
-
252
-
253
-
254
-
255
-
256
-
257
-
258
-
259
-
260
-
261
-
262
-
263
-
264
-
265
-
266
-
267
-
268
-
269
-
270
-
271
-
272
-
273
-
274
-
275
 |
 |

PART II
DUKE ENERGY CORPORATION •DUKE ENERGY CAROLINAS, LLC •DUKE ENERGY OHIO, INC. •DUKE ENERGY INDIANA, INC.
Combined Notes to Consolidated Financial Statements – (Continued)
VIEs. Restricted cash balances are reflected within both Other within
Current Assets and Other within Investments and Other Assets on the
Consolidated Balance Sheets.
December 31,
(in millions) 2011 2010
Duke Energy $104 $126
Duke Energy Carolinas —2
Duke Energy Ohio 30 4
Duke Energy Indiana —6
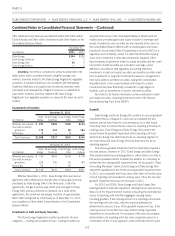
Inventory. Inventory is comprised of amounts presented in the
tables below and is recorded primarily using the average cost
method. Inventory related to the Duke Energy Registrants’ regulated
operations is valued at historical cost consistent with ratemaking
treatment. Materials and supplies are recorded as inventory when
purchased and subsequently charged to expense or capitalized to
plant when installed. Inventory related to the Duke Energy
Registrants’ non-regulated operations is valued at the lower of cost or
market.
Components of Inventory
December 31, 2011
(in millions)
Duke
Energy
Duke Energy
Carolinas
Duke Energy
Ohio
Duke Energy
Indiana
Materials and supplies $ 873 $505 $150 $134
Coal held for electric
generation 712 412 90 196
Natural gas 3— 3—
Total Inventory $1,588 $917 $243 $330
December 31, 2010
(in millions)
Duke
Energy
Duke Energy
Carolinas
Duke Energy
Ohio
Duke Energy
Indiana
Materials and supplies $ 734 $476 $106 $ 78
Coal held for electric
generation 528 240 92 189
Natural gas 56 — 56 —
Total Inventory $1,318 $716 $254 $267
Effective November 1, 2011, Duke Energy Ohio executed an
agreement with a third party to transfer title of natural gas inventory
purchased by Duke Energy Ohio to the third party. Under the
agreements, the gas inventory was stored and managed for Duke
Energy Ohio and was delivered on demand. As a result of the
agreements, the combined natural gas inventory of approximately
$50 million being held by a third party as of December 31, 2011,
was classified as Other within Current Assets on the Consolidated
Balance Sheets.
Investments in Debt and Equity Securities.
The Duke Energy Registrants classify investments into two
categories — trading and available-for-sale. Trading securities are
reported at fair value in the Consolidated Balance Sheets with net
realized and unrealized gains and losses included in earnings each
period. Available-for-sale securities are also reported at fair value on
the Consolidated Balance Sheets with unrealized gains and losses
included in Accumulated Other Comprehensive Income (AOCI) or a
regulatory asset or liability, unless it is determined that the carrying
value of an investment is other-than-temporarily impaired. Other-
than-temporary impairments related to equity securities and the credit
loss portion of debt securities are included in earnings, unless
deferred in accordance with regulatory accounting treatment.
Investments in debt and equity securities are classified as either short-
term investments or long-term investments based on management’s
intent and ability to sell these securities, taking into consideration
illiquidity factors in the current markets with respect to certain
investments that have historically provided for a high degree of
liquidity, such as investments in auction rate debt securities.
See Note 16 for further information on the investments in debt
and equity securities, including investments held in the Nuclear
Decommissioning Trust Fund (NDTF).
Goodwill.
Duke Energy and Duke Energy Ohio perform an annual goodwill
impairment test as of August 31 each year and updates the test
between annual tests if events or circumstances occur that would
more likely than not reduce the fair value of a reporting unit below its
carrying value. Duke Energy and Duke Energy Ohio perform the
annual review for goodwill impairment at the reporting unit level,
which Duke Energy has determined to be an operating segment or
one level below and Duke Energy Ohio has determined to be an
operating segment.
The annual goodwill impairment test has historically required a
two step process. However in 2011 Duke Energy and Duke Energy
Ohio adopted revised accounting guidance, which allows an entity to
first assess qualitative factors to determine whether it is necessary to
perform the two step goodwill impairment test. As discussed in “New
Accounting Standards” below, Duke Energy and Duke Energy Ohio
utilized the qualitative factors for the annual goodwill impairment test
in 2011, and concluded that it was more likely than not the fair value
of each reporting unit exceeded its carrying value. Thus, the two step
goodwill impairment test was not necessary in 2011.
For 2010 and 2009, Duke Energy and Duke Energy Ohio
tested goodwill for potential impairment utilizing the two step process.
Step one of the impairment test involves comparing the estimated fair
values of reporting units with their aggregate carrying values,
including goodwill. If the carrying amount of a reporting unit exceeds
the reporting unit’s fair value, step two must be performed to
determine the amount, if any, of the goodwill impairment loss. If the
carrying amount is less than fair value, further testing of goodwill
impairment is not performed. For purposes of the step one analyses,
determination of a reporting unit’s fair value is typically based on a
combination of the income approach, which estimates the fair value
102