Duke Energy 2011 Annual Report Download - page 228
Download and view the complete annual report
Please find page 228 of the 2011 Duke Energy annual report below. You can navigate through the pages in the report by either clicking on the pages listed below, or by using the keyword search tool below to find specific information within the annual report.-
 1
1 -
2
-
3
-
4
-
5
-
6
-
7
-
8
-
9
-
10
-
11
-
12
-
13
-
14
-
15
-
16
-
17
-
18
-
19
-
20
-
21
-
22
-
23
-
24
-
25
-
26
-
27
-
28
-
29
-
30
-
31
-
32
-
33
-
34
-
35
-
36
-
37
-
38
-
39
-
40
-
41
-
42
-
43
-
44
-
45
-
46
-
47
-
48
-
49
-
50
-
51
-
52
-
53
-
54
-
55
-
56
-
57
-
58
-
59
-
60
-
61
-
62
-
63
-
64
-
65
-
66
-
67
-
68
-
69
-
70
-
71
-
72
-
73
-
74
-
75
-
76
-
77
-
78
-
79
-
80
-
81
-
82
-
83
-
84
-
85
-
86
-
87
-
88
-
89
-
90
-
91
-
92
-
93
-
94
-
95
-
96
-
97
-
98
-
99
-
100
-
101
-
102
-
103
-
104
-
105
-
106
-
107
-
108
-
109
-
110
-
111
-
112
-
113
-
114
-
115
-
116
-
117
-
118
-
119
-
120
-
121
-
122
-
123
-
124
-
125
-
126
-
127
-
128
-
129
-
130
-
131
-
132
-
133
-
134
-
135
-
136
-
137
-
138
-
139
-
140
-
141
-
142
-
143
-
144
-
145
-
146
-
147
-
148
-
149
-
150
-
151
-
152
-
153
-
154
-
155
-
156
-
157
-
158
-
159
-
160
-
161
-
162
-
163
-
164
-
165
-
166
-
167
-
168
-
169
-
170
-
171
-
172
-
173
-
174
-
175
-
176
-
177
-
178
-
179
-
180
-
181
-
182
-
183
-
184
-
185
-
186
-
187
-
188
-
189
-
190
-
191
-
192
-
193
-
194
-
195
-
196
-
197
-
198
-
199
-
200
-
201
-
202
-
203
-
204
-
205
-
206
-
207
-
208
-
209
-
210
-
211
-
212
-
213
-
214
-
215
-
216
-
217
-
 218
218 -
 219
219 -
 220
220 -
 221
221 -
 222
222 -
 223
223 -
 224
224 -
 225
225 -
 226
226 -
 227
227 -
 228
228 -
 229
229 -
 230
230 -
 231
231 -
 232
232 -
 233
233 -
 234
234 -
 235
235 -
 236
236 -
 237
237 -
 238
238 -
239
-
240
-
241
-
242
-
243
-
244
-
245
-
246
-
247
-
248
-
249
-
250
-
251
-
252
-
253
-
254
-
255
-
256
-
257
-
258
-
259
-
260
-
261
-
262
-
263
-
264
-
265
-
266
-
267
-
268
-
269
-
270
-
271
-
272
-
273
-
274
-
275
 |
 |

PART II
DUKE ENERGY CORPORATION •DUKE ENERGY CAROLINAS, LLC •DUKE ENERGY OHIO, INC. •DUKE ENERGY INDIANA, INC.
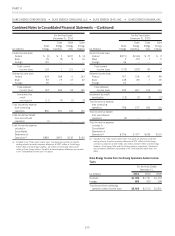
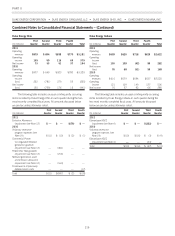
Combined Notes to Consolidated Financial Statements – (Continued)
Reconciliation of Funded Status to Accrued Other Post-Retirement
Benefit Costs
As of and for the Years
Ended December 31,
(in millions) 2011 2010
Change in Benefit Obligation
Accumulated post-retirement benefit obligation
at prior measurement date $152 $154
Service cost 11
Interest cost 78
Plan participants’ contributions 43
Actuarial (gain) loss (17) 1
Benefits paid (14) (15)
Transfers —(1)
Early retiree reinsurance program subsidy 1—
Accrued retiree drug subsidy 11
Accumulated post-retirement benefit obligation
at measurement date $135 $152
Change in Fair Value of Plan Assets
Plan assets at prior measurement date $14 $13
Actual return on plan assets —2
Benefits paid (14) (15)
Employer contributions 10 11
Plan participants’ contributions 43
Plan assets at measurement date $14 $14
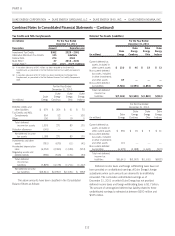
Amounts Recognized in the Consolidated Balance Sheets: Other
Post-Retirement Benefit Plans
The following table provides the amounts related to Duke Energy
Indiana’s other post-retirement benefit plans that are reflected in
Other within Deferred Credits and Other Liabilities on the
Consolidated Balance Sheets at December 31, 2011 and 2010:
As of December 31,
(in millions) 2011 2010
Accrued other post-retirement liability(a) $(121) $(138)
(a) Includes an insignificant amount recognized in Other within Current Liabilities on the
Consolidated Balance Sheets as of both December 31, 2011 and 2010.
The following table provides the amounts related to Duke Energy
Indiana’s other post-retirement benefit plans that are reflected in
Other within Regulatory Assets and Deferred Debits and within Other
within Deferred Credits and Other Liabilities on the Consolidated
Balance Sheets at December 31, 2011 and 2010:
As of December 31,
2011 2010
(in millions)
Regulatory assets $83 $90
Regulatory liabilities 70 58
Assumptions Used for Other Post-retirement Benefits Accounting
As of December 31,
(percentages) 2011 2010 2009
Benefit Obligations
Discount rate 5.10 5.00 5.50
Net Periodic Benefit Cost
Discount rate 5.00 5.50 6.50
Expected long-term rate of return on plan
assets 8.25 8.50 8.50
The discount rate used to determine the current year other post-
retirement benefits obligation and following year’s other post-
retirement benefits expense is based on a bond selection-settlement
portfolio approach. This approach develops a discount rate by
selecting a portfolio of high quality corporate bonds that generate
sufficient cash flow to provide for the projected benefit payments of
the plan. The selected bond portfolio is derived from a universe of
non-callable corporate bonds rated Aa quality or higher. After the
bond portfolio is selected, a single interest rate is determined that
equates the present value of the plan’s projected benefit payments
discounted at this rate with the market value of the bonds selected.
Assumed Health Care Cost Trend Rate
2011 2010
Health care cost trend rate assumed for next year 8.75% 8.50%
Rate to which the cost trend is assumed to decline (the
ultimate trend rate) 5.00% 5.00%
Year that the rate reaches the ultimate trend rate 2020 2020
Sensitivity to Changes in Assumed Health Care Cost Trend
Rates
(in millions)
1-Percentage-
Point Increase
1-Percentage-
Point Decrease
Effect on total service and interest
costs $ 1 $ (1)
Effect on post-retirement benefit
obligation 18 (16)
208