MetLife 2006 Annual Report Download - page 9
Download and view the complete annual report
Please find page 9 of the 2006 MetLife annual report below. You can navigate through the pages in the report by either clicking on the pages listed below, or by using the keyword search tool below to find specific information within the annual report.-
 1
1 -
 2
2 -
 3
3 -
 4
4 -
 5
5 -
 6
6 -
 7
7 -
 8
8 -
 9
9 -
 10
10 -
 11
11 -
 12
12 -
 13
13 -
 14
14 -
 15
15 -
 16
16 -
 17
17 -
 18
18 -
 19
19 -
 20
20 -
21
-
22
-
23
-
24
-
25
-
26
-
27
-
28
-
29
-
30
-
31
-
32
-
33
-
34
-
35
-
36
-
37
-
38
-
39
-
40
-
41
-
42
-
43
-
44
-
45
-
46
-
47
-
48
-
49
-
50
-
51
-
52
-
53
-
54
-
55
-
56
-
57
-
58
-
59
-
60
-
61
-
62
-
63
-
64
-
65
-
66
-
67
-
68
-
69
-
70
-
71
-
72
-
73
-
74
-
75
-
76
-
77
-
78
-
79
-
80
-
81
-
82
-
83
-
84
-
85
-
86
-
87
-
88
-
89
-
90
-
91
-
92
-
93
-
94
-
95
-
96
-
97
-
98
-
99
-
100
-
101
-
102
-
103
-
104
-
105
-
106
-
107
-
108
-
109
-
110
-
111
-
112
-
113
-
114
-
115
-
116
-
117
-
118
-
119
-
120
-
121
-
122
-
123
-
124
-
125
-
126
-
127
-
128
-
129
-
130
-
131
-
132
-
133
-
134
-
135
-
136
-
137
-
138
-
139
-
140
-
141
-
142
-
143
-
144
-
145
-
146
-
147
-
148
-
149
-
150
-
151
-
152
-
153
-
154
-
155
-
156
-
157
-
158
-
159
-
160
-
161
-
162
-
163
-
164
-
165
-
166
 |
 |
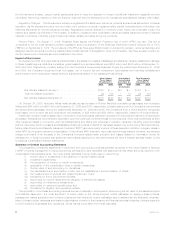
well as gains on the sales of SSRM and MetLife Indonesia of $177 million and $10 million, respectively, both net of income tax. In addition,
there was lower net investment income and net investment gains from discontinued operations related to other real estate properties sold
or held-for-sale during the year ended December 31, 2006 compared to the year ended December 31, 2005.
Net investment losses increased by $817 million, net of income tax, to a loss of $877 million for the year ended December 31, 2006
from a loss of $60 million for the comparable 2005 period. Excluding the impact of the acquisition of Travelers, which contributed a loss of
$177 million during the first six months of 2006 to the year over year increase, net investment losses increased by $640 million. The
increase in net investment losses was due to a combination of losses from the mark-to-market on derivatives and foreign currency
transaction losses during 2006, largely driven by increases in U.S. interest rates and the weakening of the dollar against the major
currencies the Company hedges, notably the euro and pound sterling.
Dividends on the Holding Company’s Series A and Series B preferred shares (“Preferred Shares”) issued in connection with financing
the acquisition of Travelers increased by $71 million, to $134 million for the year ended December 31, 2006, from $63 million for the
comparable 2005 period, as the preferred stock was issued in June 2005.
The remainder of the increase of $350 million in net income available to common shareholders for the year ended December 31, 2006
compared to the 2005 period was primarily due to an increase in premiums, fees and other revenues attributable to continued business
growth across all of the Company’s operating segments. Also contributing to the increase was higher net investment income primarily due
to an overall increase in the asset base, an increase in fixed maturity security yields, improved results on real estate and real estate joint
ventures, mortgage loans, and other limited partnership interests, as well as higher short-term interest rates on cash equivalents and short-
term investments. These increases were partially offset by a decline in net investment income from securities lending results, and bond and
commercial mortgage prepayment fees. Favorable underwriting results for the year ended December 31, 2006 were partially offset by a
decrease in net interest margins. These increases were partially offset by an increase in expenses primarily due to higher interest expense
on debt, increased general spending, higher compensation and commission costs and higher expenses related to growth initiatives and
information technology projects, partially offset by a reduction in Travelers’ integration expenses, principally corporate incentives.
Year ended December 31, 2005 compared with the year ended December 31, 2004
The Company reported $4,651 million in net income available to common shareholders and diluted earnings per common share of
$6.16 for the year ended December 31, 2005 compared to $2,758 million in net income available to common shareholders and diluted
earnings per common share of $3.65 for the year ended December 31, 2004. The acquisition of Travelers contributed $233 million to net
income available to common shareholders for the year ended December 31, 2005. Excluding the impact of Travelers, net income available
to common shareholders increased by $1,660 million in the 2005 period. The years ended December 31, 2005 and 2004 include the
impact of certain transactions or events, the timing, nature and amount of which are generally unpredictable. These transactions are
described in each applicable segment’s discussion below. These items contributed a benefit of $71 million, net of income tax, to the year
ended December 31, 2005 and a benefit of $113 million, net of income tax, to the comparable 2004 period. Excluding the impact of these
items, net income available to common shareholders increased by $1,702 million for the year ended December 31, 2005 compared to the
prior 2004 period.
In 2005, the Company sold its One Madison Avenue and 200 Park Avenue properties in Manhattan, New York, which, combined,
resulted in a gain of $1,193 million, net of income tax. In addition, during 2005, the Company completed the sales of SSRM and MetLife
Indonesia and recognized gains of $177 million and $10 million, respectively, both net of income tax. In 2004, the Company completed the
sale of the Sears Tower property resulting in a gain of $85 million, net of income tax. Accordingly, income from discontinued operations
and, correspondingly, net income, increased by $1,370 million for the year ended December 31, 2005 compared to the 2004 period
primarily as a result of the aforementioned sales.
These increases were partially offset by an increase in net investment losses of $170 million, net of income tax, for the year ended
December 31, 2005 as compared to the corresponding period in 2004. The acquisition of Travelers contributed a loss of $132 million, net
of income tax, to this decrease. Excluding the impact of Travelers, net investment gains (losses) decreased by $38 million, net of income
tax, in the 2005 period. This decrease is primarily due to losses on fixed maturity security sales resulting from continued portfolio
repositioning in the 2005 period. Significantly offsetting these reductions is an increase in gains from the mark-to-market on derivatives in
2005. The derivative gains resulted from changes in the value of the dollar versus major foreign currencies, including the euro and pound
sterling, and changes in U.S. interest rates during the year ended December 31, 2005.
The increase in net income available to common shareholders during the year ended December 31, 2005 as compared to the prior year
is partially due to the decrease in net income available to common shareholders in the prior year of $86 million, net of income tax, as a
result of a cumulative effect of a change in accounting principle in 2004 recorded in accordance with Statement of Position (“SOP”) 03-1,
Accounting and Reporting by Insurance Enterprises for Certain Nontraditional Long-Duration Contracts and for Separate Accounts
(“SOP 03-1”).
In addition, during the second half of the year ended December 31, 2005, the Holding Company paid $63 million in dividends on the
Preferred Shares issued in connection with financing the acquisition of Travelers.
The remaining increase in net income available to common shareholders of $347 million is primarily due to an increase in premiums,
fees and other revenues primarily from continued sales growth across most of the Company’s business segments, as well as the positive
impact of the U.S. financial markets on policy fees. Policy fees from variable life and annuity and investment-type products are typically
calculated as a percentage of the average assets in policyholder accounts. The value of these assets can fluctuate depending on equity
performance. In addition, continued strong investment spreads are largely due to higher than expected net investment income from
corporate joint venture income and bond and commercial mortgage prepayment fees. Partially offsetting these increases is a rise in
expenses primarily due to higher interest expense, integration costs, corporate incentive expenses, non deferrable volume-related
expenses, corporate support expenses and DAC amortization.
Acquisitions and Dispositions
On September 29, 2005, the Company completed the sale of MetLife Indonesia to a third party, resulting in a gain upon disposal of
$10 million, net of income tax. As a result of this sale, the Company recognized income (loss) from discontinued operations of $5 million
and ($9) million, net of income tax, for the years ended December 31, 2005 and 2004, respectively. The Company reclassified the
operations of MetLife Indonesia into discontinued operations for all years presented.
6MetLife, Inc.