MetLife 2006 Annual Report Download - page 59
Download and view the complete annual report
Please find page 59 of the 2006 MetLife annual report below. You can navigate through the pages in the report by either clicking on the pages listed below, or by using the keyword search tool below to find specific information within the annual report.-
 1
1 -
2
-
3
-
4
-
5
-
6
-
7
-
8
-
9
-
10
-
11
-
12
-
13
-
14
-
15
-
16
-
17
-
18
-
19
-
20
-
21
-
22
-
23
-
24
-
25
-
26
-
27
-
28
-
29
-
30
-
31
-
32
-
33
-
34
-
35
-
36
-
37
-
38
-
39
-
40
-
41
-
42
-
43
-
44
-
45
-
46
-
47
-
48
-
 49
49 -
 50
50 -
 51
51 -
 52
52 -
 53
53 -
 54
54 -
 55
55 -
 56
56 -
 57
57 -
 58
58 -
 59
59 -
 60
60 -
 61
61 -
 62
62 -
 63
63 -
 64
64 -
 65
65 -
 66
66 -
 67
67 -
 68
68 -
 69
69 -
70
-
71
-
72
-
73
-
74
-
75
-
76
-
77
-
78
-
79
-
80
-
81
-
82
-
83
-
84
-
85
-
86
-
87
-
88
-
89
-
90
-
91
-
92
-
93
-
94
-
95
-
96
-
97
-
98
-
99
-
100
-
101
-
102
-
103
-
104
-
105
-
106
-
107
-
108
-
109
-
110
-
111
-
112
-
113
-
114
-
115
-
116
-
117
-
118
-
119
-
120
-
121
-
122
-
123
-
124
-
125
-
126
-
127
-
128
-
129
-
130
-
131
-
132
-
133
-
134
-
135
-
136
-
137
-
138
-
139
-
140
-
141
-
142
-
143
-
144
-
145
-
146
-
147
-
148
-
149
-
150
-
151
-
152
-
153
-
154
-
155
-
156
-
157
-
158
-
159
-
160
-
161
-
162
-
163
-
164
-
165
-
166
 |
 |

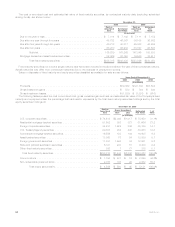
The following table summarizes the actual and target weighted-average allocations of other postretirement benefit plan assets within the
separate accounts:
2006 2005 2007
Weighted
Average
Actual
Allocation
Weighted
Average
Target
Allocation
December 31,
Asset Category
Equitysecurities ....................................................... 37% 42% 30%-45%
Fixedmaturities........................................................ 57% 53% 45%-70%
Other .............................................................. 6% 5% 0%-10%
Total ............................................................. 100% 100%
Target allocations of assets are determined with the objective of maximizing returns and minimizing volatility of net assets through
adequate asset diversification. Adjustments are made to target allocations based on an assessment of the impact of economic factors and
market conditions.
Funding and Cash Flows of Pension and Other Postretirement Benefit Plan Obligations
Pension Plan Obligations
It is the Subsidiaries’ practice to make contributions to the qualified pension plans to comply with minimum funding requirements of the
ERISA, as amended, and/or to maintain a fully funded ABO. In accordance with such practice, no contributions were required for the years
ended December 31, 2006 or 2005. No contributions will be required for 2007. The Subsidiaries elected to make discretionary
contributions to the qualified pension plans of $350 million for the year ended December 31, 2006. No contributions were made during
the year ended December 31, 2005. The Subsidiaries expect to make additional discretionary contributions of $150 million in 2007.
Benefit payments due under the non-qualified pension plans are funded from the Subsidiaries’ general assets as they become due
under the provision of the plans. These payments totaled $38 million and $35 million for the years ended December 31, 2006 and 2005,
respectively. These benefit payments are expected to be at approximately the same level in 2007.
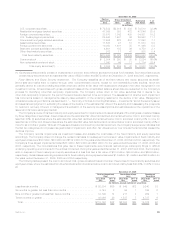
Gross pension benefit payments for the next ten years, which reflect expected future service as appropriate, are expected to be as
follows:
Pension
Benefits
(In millions)
2007................................................................... $ 337
2008................................................................... $ 349
2009................................................................... $ 367
2010................................................................... $ 372
2011................................................................... $ 385
2012-2016............................................................... $2,141
Other Postretirement Benefit Plan Obligations
Other postretirement benefits represent a non-vested, non-guaranteed obligation of the Subsidiaries and current regulations do not
require specific funding levels for these benefits. While the Subsidiaries have funded such plans in advance, it has been the Subsidiaries’
practice to use their general assets to pay claims as they come due in lieu of utilizing plan assets. These payments totaled $152 million and
$160 million for the years ended December 31, 2006 and 2005, respectively.
The Subsidiaries’ expect to make contributions of $132 million, based upon expected gross benefit payments, towards the other
postretirement plan obligations in 2007. As noted previously, the Subsidiaries expect to receive subsidies under the Prescription Drug Act
to partially offset such payments.
Gross other postretirement benefit payments for the next ten years, which reflect expected future service where appropriate, and gross
subsidies to be received under the Prescription Drug Act are expected to be as follows:
Gross
Benefits Prescription
Drug Subsidies Net
Benefits
(In millions)
2007................................................... $132 $(14) $118
2008................................................... $137 $(14) $123
2009................................................... $142 $(15) $127
2010................................................... $148 $(16) $132
2011................................................... $154 $(16) $138
2012-2016 . . . . . . . . . . . . . . . . . . . . . . . . . . . . . . . . . . . . . . . . . . . . . . . $837 $(98) $739
Insolvency Assessments
Most of the jurisdictions in which the Company is admitted to transact business require life insurers doing business within the
jurisdiction to participate in guaranty associations, which are organized to pay contractual benefits owed pursuant to insurance policies
issued by impaired, insolvent or failed life insurers. These associations levy assessments, up to prescribed limits, on all member insurers in
a particular state on the basis of the proportionate share of the premiums written by member insurers in the lines of business in which the
56 MetLife, Inc.