MetLife 2006 Annual Report Download - page 117
Download and view the complete annual report
Please find page 117 of the 2006 MetLife annual report below. You can navigate through the pages in the report by either clicking on the pages listed below, or by using the keyword search tool below to find specific information within the annual report.-
 1
1 -
2
-
3
-
4
-
5
-
6
-
7
-
8
-
9
-
10
-
11
-
12
-
13
-
14
-
15
-
16
-
17
-
18
-
19
-
20
-
21
-
22
-
23
-
24
-
25
-
26
-
27
-
28
-
29
-
30
-
31
-
32
-
33
-
34
-
35
-
36
-
37
-
38
-
39
-
40
-
41
-
42
-
43
-
44
-
45
-
46
-
47
-
48
-
49
-
50
-
51
-
52
-
53
-
54
-
55
-
56
-
57
-
58
-
59
-
60
-
61
-
62
-
63
-
64
-
65
-
66
-
67
-
68
-
69
-
70
-
71
-
72
-
73
-
74
-
75
-
76
-
77
-
78
-
79
-
80
-
81
-
82
-
83
-
84
-
85
-
86
-
87
-
88
-
89
-
90
-
91
-
92
-
93
-
94
-
95
-
96
-
97
-
98
-
99
-
100
-
101
-
102
-
103
-
104
-
105
-
106
-
 107
107 -
 108
108 -
 109
109 -
 110
110 -
 111
111 -
 112
112 -
 113
113 -
 114
114 -
 115
115 -
 116
116 -
 117
117 -
 118
118 -
 119
119 -
 120
120 -
 121
121 -
 122
122 -
 123
123 -
 124
124 -
 125
125 -
 126
126 -
 127
127 -
128
-
129
-
130
-
131
-
132
-
133
-
134
-
135
-
136
-
137
-
138
-
139
-
140
-
141
-
142
-
143
-
144
-
145
-
146
-
147
-
148
-
149
-
150
-
151
-
152
-
153
-
154
-
155
-
156
-
157
-
158
-
159
-
160
-
161
-
162
-
163
-
164
-
165
-
166
 |
 |

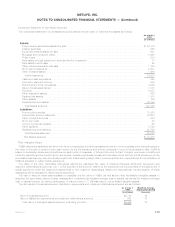
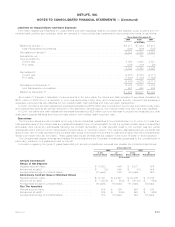
During the years ended December 31, 2006 and 2005, interest and dividends earned on trading securities in addition to the net realized
and unrealized gains (losses) recognized on the trading securities and the related short sale agreement liabilities totaled $71 million and
$14 million, respectively. Changes in the fair value of such trading securities and short sale agreement liabilities, totaled $26 million and
less than a million for the years ended December 31, 2006 and 2005, respectively. The Company did not have any trading securities during
the year ended December 31, 2004.
Structured Investment Transactions
The Company invests in structured notes and similar type instruments, which generally provide equity-based returns on debt securities.
The carrying value of such investments, included in fixed maturity securities, was $354 million and $362 million at December 31, 2006 and
2005, respectively. The related net investment income recognized was $43 million, $28 million and $45 million for the years ended
December 31, 2006, 2005 and 2004, respectively.
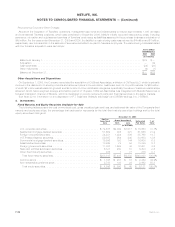
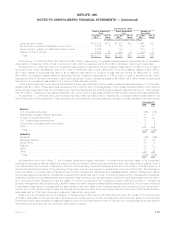
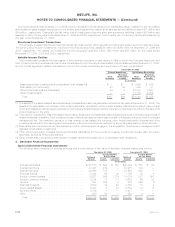
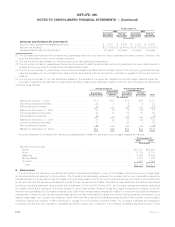
Variable Interest Entities
The following table presents the total assets of and maximum exposure to loss relating to VIEs for which the Company has concluded
that: (i) it is the primary beneficiary and which are consolidated in the Company’s consolidated financial statements at December 31, 2006;
and (ii) it holds significant variable interests but it is not the primary beneficiary and which have not been consolidated:
Total
Assets(1)
Maximum
Exposure to
Loss(2) Total
Assets(1)
Maximum
Exposure to
Loss(2)
Primary Beneficiary Not Primary Beneficiary
December 31, 2006
(In millions)
Asset-backed securitizations and collateralized debt obligations . . . . . . . . . . $ — $— $ 1,909 $ 246
Realestatejointventures(3) ................................. 53 45 399 41
Otherlimitedpartnershipsinterests(4)........................... 84 3 20,770 1,583
Otherinvestments(5)...................................... — — 31,170 2,356
Total ............................................... $137 $48 $54,248 $4,226
(1) The assets of the asset-backed securitizations and collateralized debt obligations are reflected at fair value at December 31, 2006. The
assets of the real estate joint ventures, other limited partnership interests and other investments are reflected at the carrying amounts at
which such assets would have been reflected on the Company’s balance sheet had the Company consolidated the VIE from the date of its
initial investment in the entity.
(2) The maximum exposure to loss of the asset-backed securitizations and collateralized debt obligations is equal to the carrying amounts of
retained interests. In addition, the Company provides collateral management services for certain of these structures for which it collects a
management fee. The maximum exposure to loss relating to real estate joint ventures, other limited partnership interests and other
investments is equal to the carrying amounts plus any unfunded commitments, reduced by amounts guaranteed by other partners.
(3) Real estate joint ventures include partnerships and other ventures which engage in the acquisition, development, management and
disposal of real estate investments.
(4) Other limited partnership interests include partnerships established for the purpose of investing in public and private debt and equity
securities, as well as limited partnerships.
(5) Other investments include securities that are not asset-backed securitizations or collateralized debt obligations.
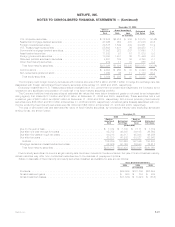
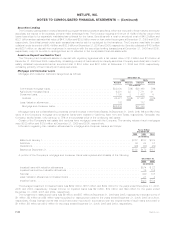
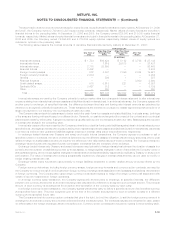
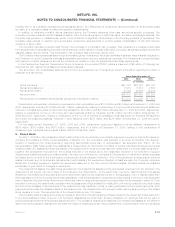
4. Derivative Financial Instruments
Types of Derivative Financial Instruments
The following table presents the notional amounts and current market or fair value of derivative financial instruments held at:
Notional
Amount Assets Liabilities Notional
Amount Assets Liabilities
Current Market
or Fair Value Current Market
or Fair Value
December 31, 2006 December 31, 2005
(In millions)
Interestrateswaps ........................... $ 27,148 $ 639 $ 150 $20,444 $ 653 $ 69
Interestratefloors............................ 37,437 279 — 10,975 134 —
Interestratecaps ............................ 26,468 125 — 27,990 242 —
Financialfutures............................. 8,432 64 39 1,159 12 8
Foreign currency swaps . . . . . . . . . . . . . . . . . . . . . . . . 19,627 986 1,174 14,274 527 991
Foreigncurrencyforwards ...................... 2,934 31 27 4,622 64 92
Options .................................. 587 306 8 815 356 6
Financialforwards............................ 3,800 12 40 2,452 13 4
Creditdefaultswaps.......................... 6,357 5 21 5,882 13 11
SyntheticGICs.............................. 3,739 — — 5,477 — —
Other.................................... 250 56 — 250 9 —
Total ................................... $136,779 $2,503 $1,459 $94,340 $2,023 $1,181
F-34 MetLife, Inc.
METLIFE, INC.
NOTES TO CONSOLIDATED FINANCIAL STATEMENTS — (Continued)