MetLife 2006 Annual Report Download - page 65
Download and view the complete annual report
Please find page 65 of the 2006 MetLife annual report below. You can navigate through the pages in the report by either clicking on the pages listed below, or by using the keyword search tool below to find specific information within the annual report.-
 1
1 -
2
-
3
-
4
-
5
-
6
-
7
-
8
-
9
-
10
-
11
-
12
-
13
-
14
-
15
-
16
-
17
-
18
-
19
-
20
-
21
-
22
-
23
-
24
-
25
-
26
-
27
-
28
-
29
-
30
-
31
-
32
-
33
-
34
-
35
-
36
-
37
-
38
-
39
-
40
-
41
-
42
-
43
-
44
-
45
-
46
-
47
-
48
-
49
-
50
-
51
-
52
-
53
-
54
-
 55
55 -
 56
56 -
 57
57 -
 58
58 -
 59
59 -
 60
60 -
 61
61 -
 62
62 -
 63
63 -
 64
64 -
 65
65 -
 66
66 -
 67
67 -
 68
68 -
 69
69 -
 70
70 -
 71
71 -
 72
72 -
 73
73 -
 74
74 -
 75
75 -
76
-
77
-
78
-
79
-
80
-
81
-
82
-
83
-
84
-
85
-
86
-
87
-
88
-
89
-
90
-
91
-
92
-
93
-
94
-
95
-
96
-
97
-
98
-
99
-
100
-
101
-
102
-
103
-
104
-
105
-
106
-
107
-
108
-
109
-
110
-
111
-
112
-
113
-
114
-
115
-
116
-
117
-
118
-
119
-
120
-
121
-
122
-
123
-
124
-
125
-
126
-
127
-
128
-
129
-
130
-
131
-
132
-
133
-
134
-
135
-
136
-
137
-
138
-
139
-
140
-
141
-
142
-
143
-
144
-
145
-
146
-
147
-
148
-
149
-
150
-
151
-
152
-
153
-
154
-
155
-
156
-
157
-
158
-
159
-
160
-
161
-
162
-
163
-
164
-
165
-
166
 |
 |

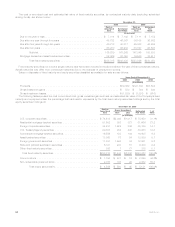
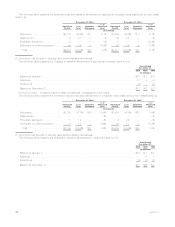
Composition of Portfolio and Investment Results
The following table illustrates the net investment income and annualized yields on average assets for each of the components of the
Company’s investment portfolio at:
2006 2005 2004
December 31,
(In millions)
FIXED MATURITY SECURITIES
Yield(1) ...................................................... 6.16% 6.00% 6.53%
Investmentincome(2) ............................................. $ 12,077 $ 10,400 $ 9,015
Investmentgains(losses)........................................... $ (1,119) $ (868) $ 71
Endingcarryingvalue(2) ........................................... $244,187 $230,875 $176,377
MORTGAGE AND CONSUMER LOANS
Yield(1) ...................................................... 6.60% 6.81% 6.99%
Investmentincome(3) ............................................. $ 2,411 $ 2,236 $ 1,951
Investmentgains(losses)........................................... $ (8) $ 17 $ (47)
Endingcarryingvalue............................................. $ 42,239 $ 37,190 $ 32,406
REAL ESTATE AND REAL ESTATE JOINT VENTURES(4)
Yield(1) ...................................................... 11.55% 10.59% 11.69%
Investmentincome............................................... $ 549 $ 467 $ 515
Investmentgains(losses)........................................... $ 4,898 $ 2,139 $ 162
Endingcarryingvalue............................................. $ 4,986 $ 4,665 $ 4,233
POLICY LOANS
Yield(1) ...................................................... 5.99% 6.00% 6.15%
Investmentincome............................................... $ 603 $ 572 $ 541
Endingcarryingvalue............................................. $ 10,228 $ 9,981 $ 8,899
EQUITY SECURITIES AND OTHER LIMITED PARTNERSHIP INTERESTS
Yield(1) ...................................................... 14.18% 12.83% 9.96%
Investmentincome............................................... $ 1,067 $ 798 $ 404
Investmentgains(losses)........................................... $ 85 $ 159 $ 208
Endingcarryingvalue............................................. $ 9,912 $ 7,614 $ 5,095
CASH AND SHORT-TERM INVESTMENTS
Yield(1) ...................................................... 5.51% 3.66% 3.00%
Investmentincome............................................... $ 442 $ 362 $ 153
Investmentgains(losses)........................................... $ (2) $ (2) $ (1)
Endingcarryingvalue............................................. $ 9,816 $ 7,324 $ 6,710
OTHER INVESTED ASSETS(5)(6)
Yield(1) ...................................................... 9.60% 8.96% 6.55%
Investmentincome............................................... $ 821 $ 570 $ 290
Investmentgains(losses)........................................... $ (705) $ 502 $ (149)
Endingcarryingvalue............................................. $ 10,428 $ 8,078 $ 5,295
TOTAL INVESTMENTS
Grossinvestmentincomeyield(1) ..................................... 6.62% 6.35% 6.69%
Investmentfeesandexpensesyield.................................... (0.15)% (0.14)% (0.14)%
NET INVESTMENT INCOME YIELD .................................. 6.47% 6.21% 6.55%
Grossinvestmentincome .......................................... $ 17,970 $ 15,405 $ 12,869
Investmentfeesandexpenses ....................................... $ (404) $ (339) $ (260)
NET INVESTMENT INCOME ....................................... $ 17,566 $ 15,066 $ 12,609
Endingcarryingvalue............................................. $331,796 $305,727 $239,015
Grossinvestmentgains............................................ $ 5,754 $ 3,340 $ 1,314
Grossinvestmentlosses........................................... $ (2,035) $ (1,578) $ (587)
Writedowns ................................................... $ (136) $ (116) $ (212)
Subtotal...................................................... $ 3,583 $ 1,646 $ 515
Derivative & other instruments not qualifying for hedge accounting . . . . . . . . . . . . . . . . $ (434) $ 301 $ (271)
INVESTMENT GAINS (LOSSES)..................................... $ 3,149 $ 1,947 $ 244
Minorityinterest—Investmentgains(losses).............................. $ — $ (9) $ (9)
Investmentgains(losses)taxbenefit(provision) ............................ $ (1,114) $ (681) $ (77)
INVESTMENT GAINS (LOSSES), NET OF INCOME TAX .................... $ 2,035 $ 1,257 $ 158
(1) Yields are based on quarterly average asset carrying values, excluding recognized and unrealized investment gains (losses), and for yield
calculation purposes, average assets exclude collateral associated with the Company’s securities lending program.
62 MetLife, Inc.